
Antarctica's ice sheet hides a vast shifting network of 231 lakes
A fresh scan of Antarctica’s under-ice landscape has revealed 85 previously unknown lakes that quietly fill and drain beneath the world’s largest ice mass.
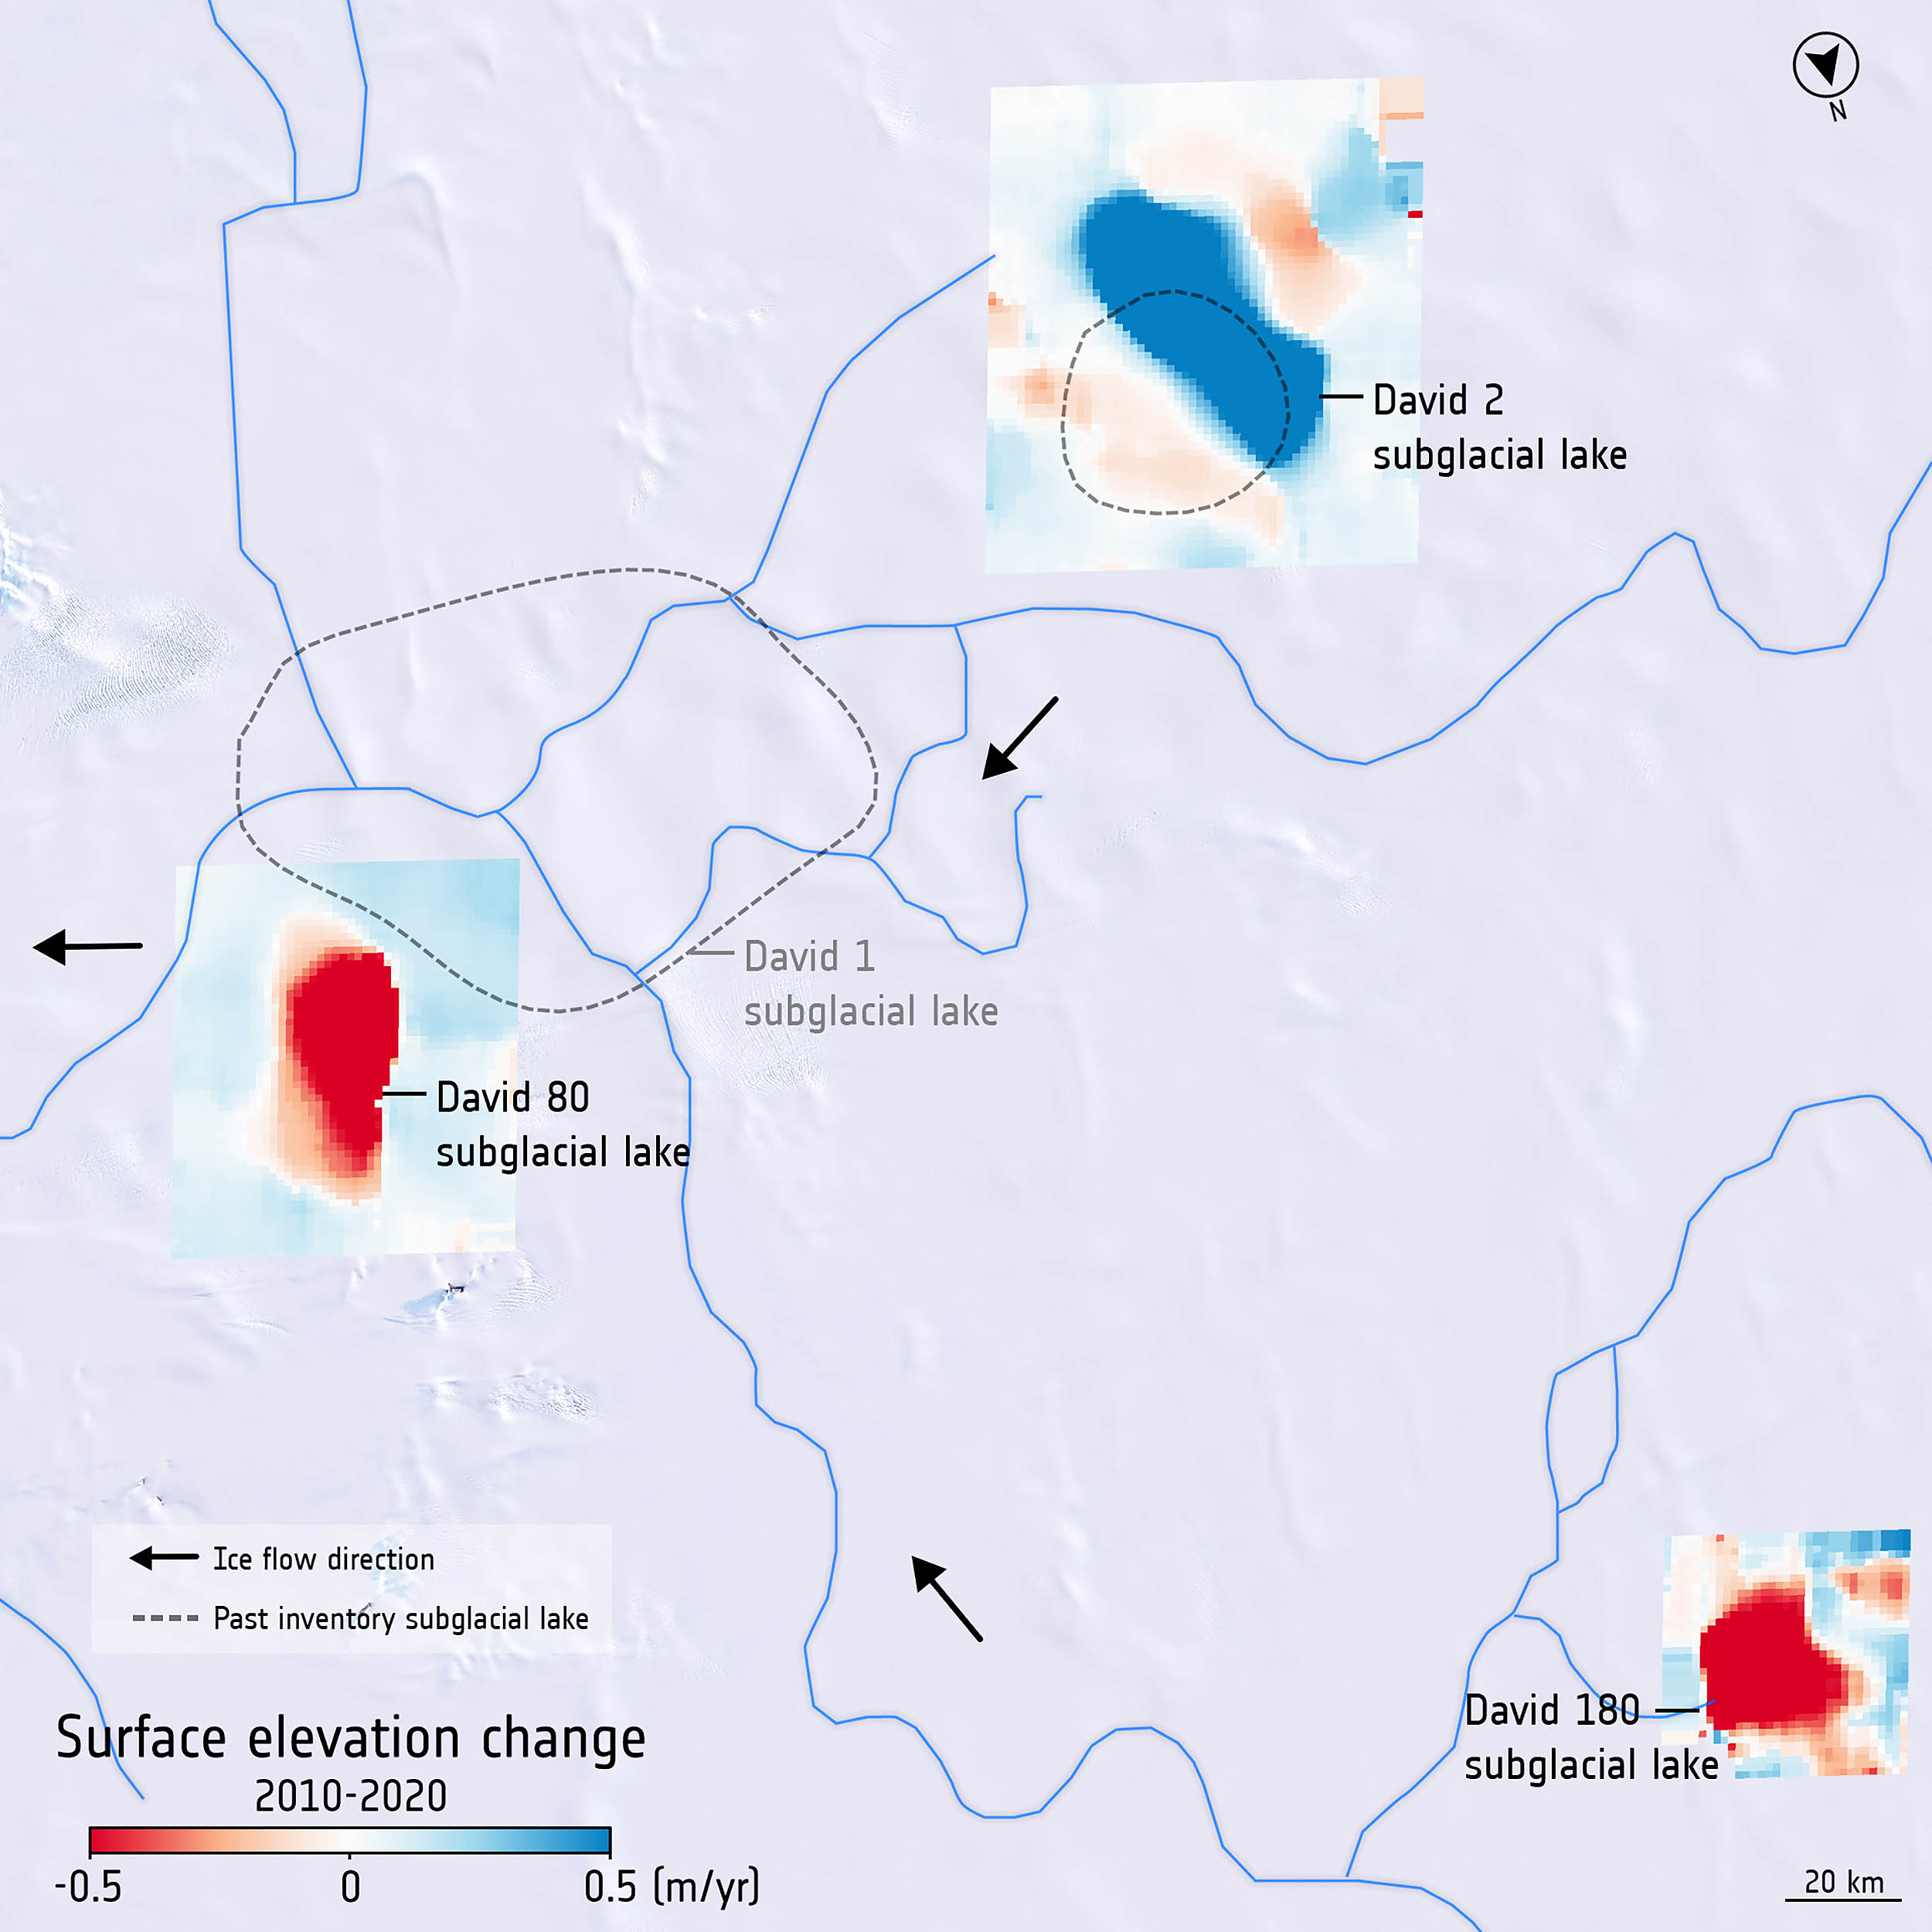
These “active” lakes change the ice surface by inches to feet as they cycle, offering rare, real-time clues to how the ice sheet moves.

The discoveries also trace new drainage routes, including five linked lake networks, that can speed or slow glaciers – and nudge future sea level.
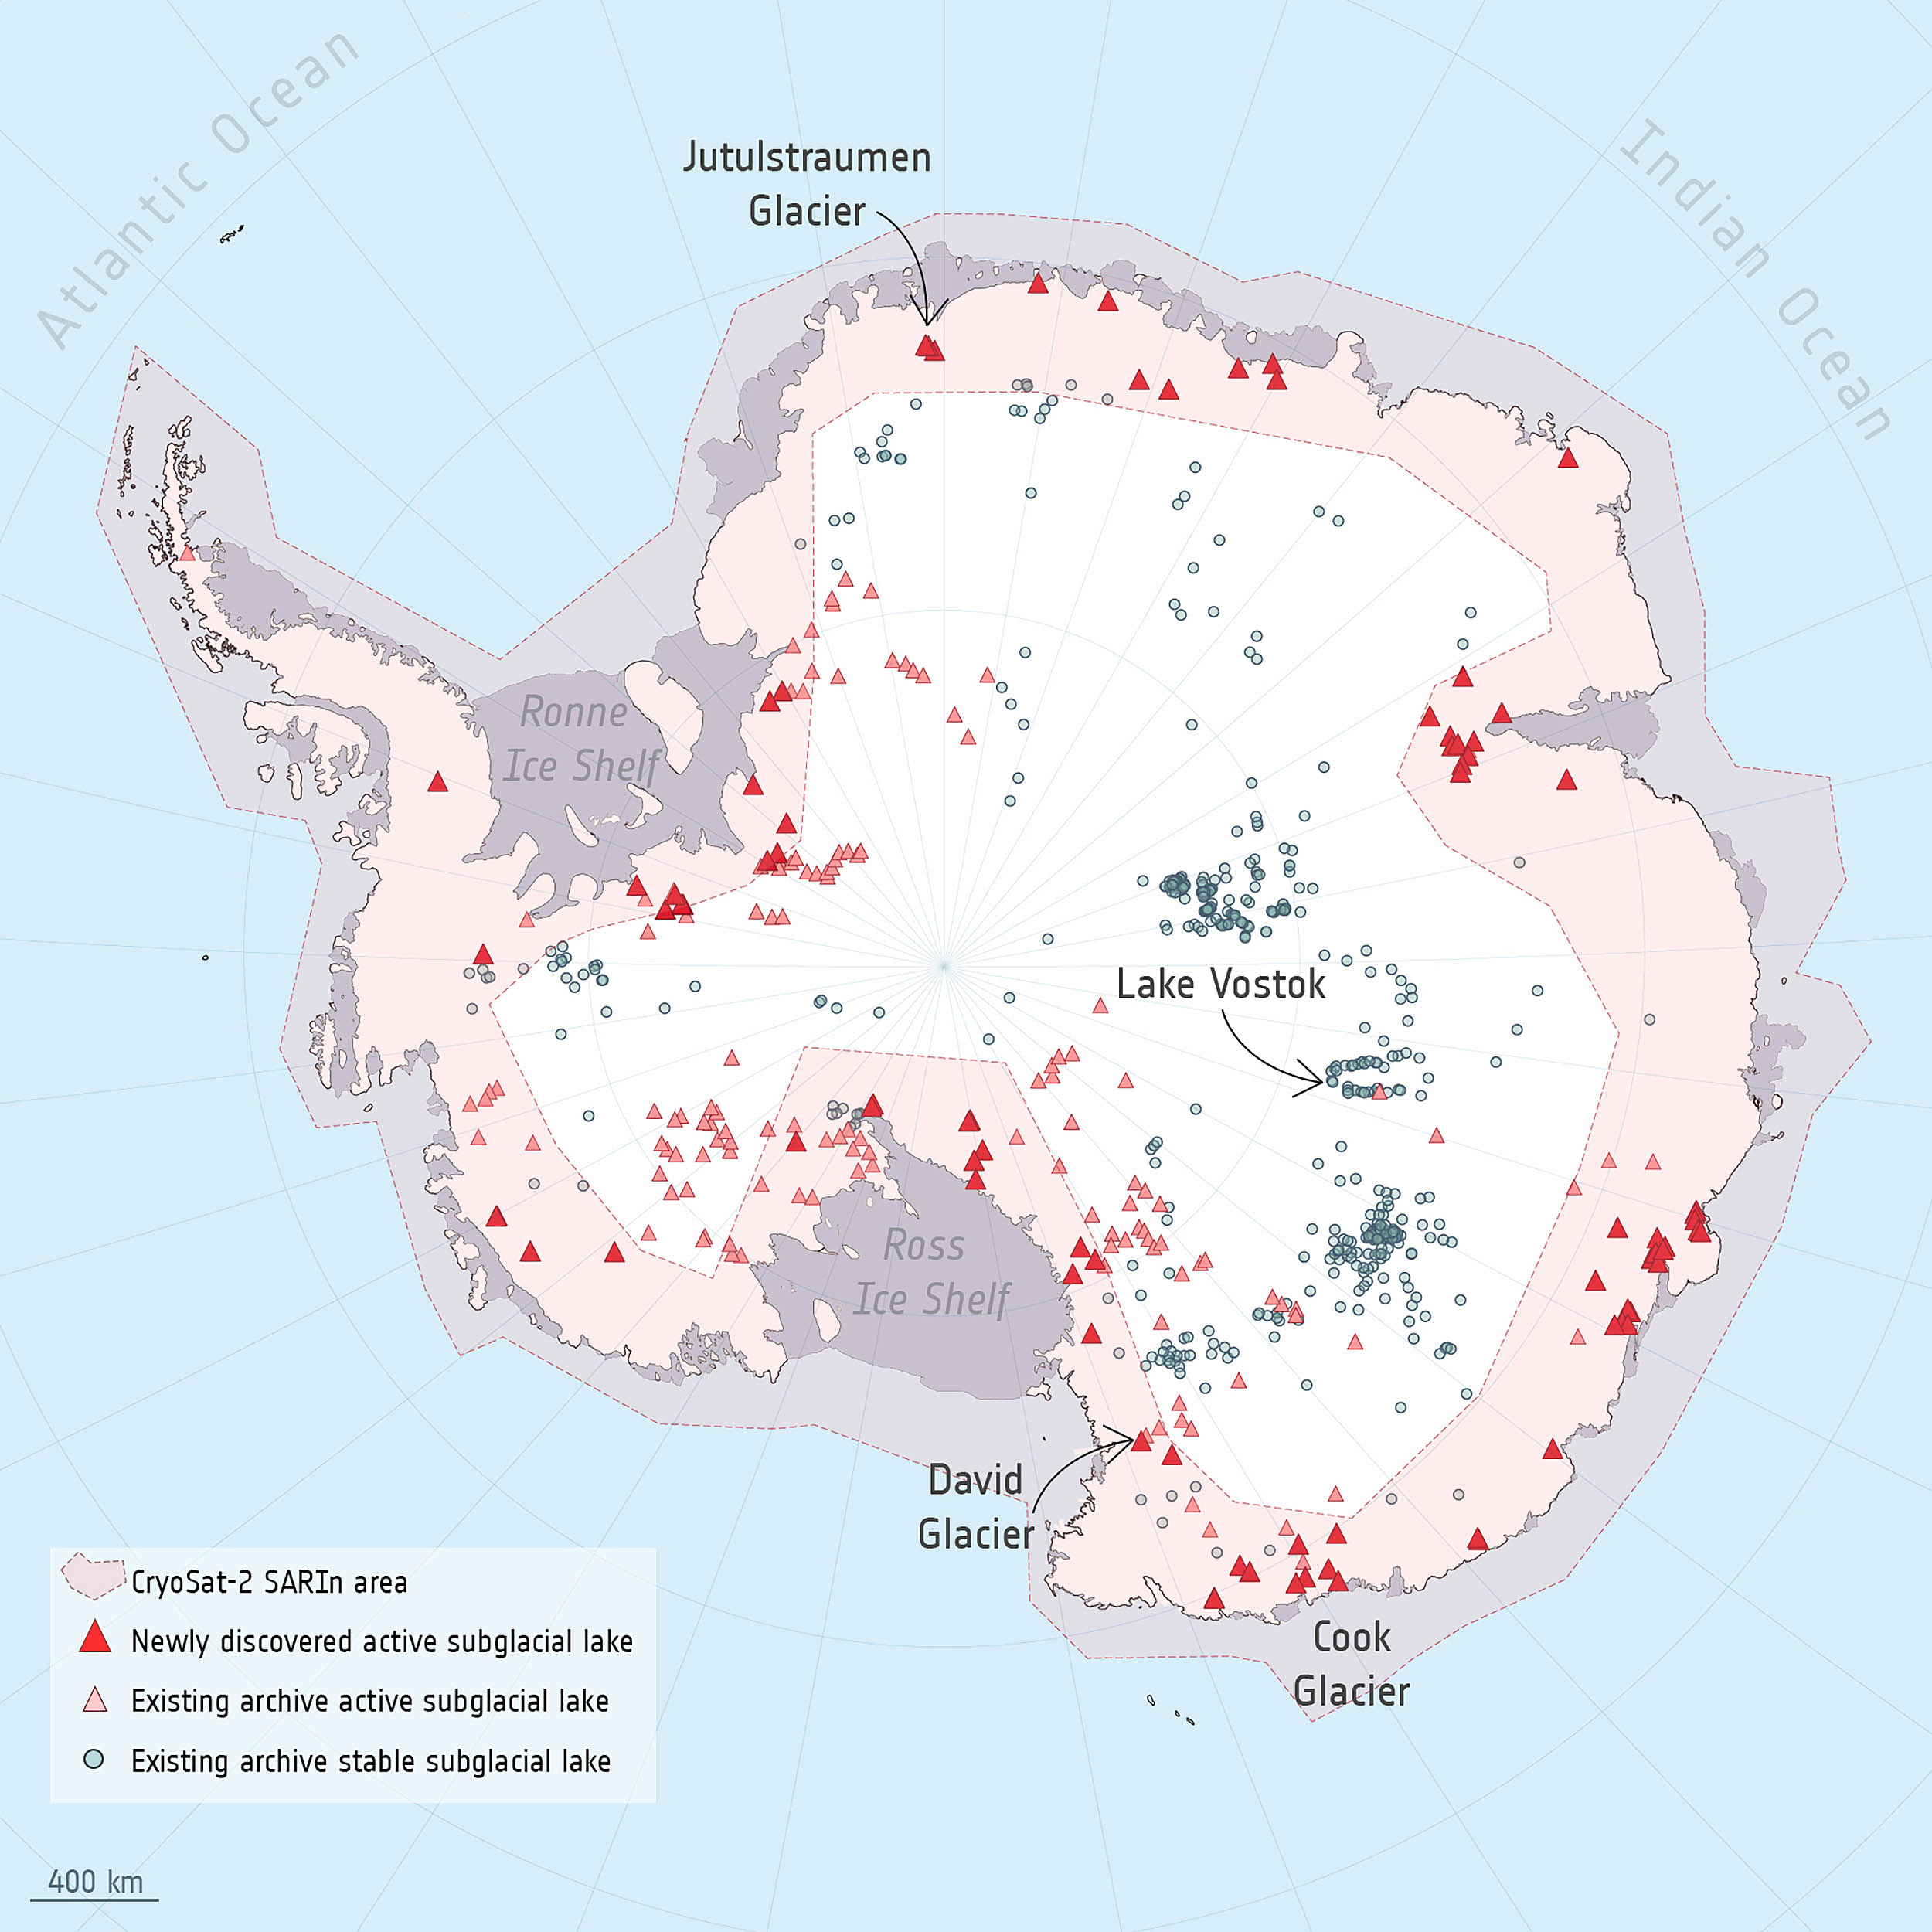
The findings come from a decade of European Space Agency CryoSat data and were led by researchers at the University of Leeds. The study increases again the tally of known active subglacial lakes, lifting it to 231.
Study lead author Sally Wilson and colleagues paired long time series with precise height measurements to watch the ice surface rise and fall as hidden lakes filled and emptied far below.
Tracking Antarctica’s icy pulse
CryoSat has tracked polar ice since 2010 using a radar altimeter that senses tiny changes in surface height. From 2010 to 2020, the team mapped local bumps and sags across Antarctica’s interior.
Those pulses are the telltale heartbeat of lakes at the base of the ice sheet. When a lake fills, the ice above lifts.
When it drains, the surface settles. String those pulses together and you get activity maps – who’s filling, who’s draining, and how fast.
“It is incredibly difficult to observe subglacial lake filling and draining events in these conditions, especially since they take several months or years to fill and drain,” Wilson said.
“Only 36 complete cycles, from the start of subglacial filling through to the end of draining, had been observed worldwide before our study. We observed 12 more complete fill-drain events, bringing the total to 48.”
Lakes in constant motion
Active lakes are windows into a realm we cannot visit. They show that water routes under the ice are not fixed plumbing. Channels widen, pinch, or reroute as pressure and flow change.
That dynamism matters because water at the bed greases the interface between ice and rock. More water in the right place can reduce friction and let ice slide faster toward the ocean.
“It was fascinating to discover that subglacial lake areas can change during different filling or draining cycles,” Wilson said.
“This shows that Antarctic subglacial hydrology is much more dynamic than previously thought, so we must continue to monitor these lakes as they evolve in the future.”
Where Antarctic lakes begin
Subglacial water comes from two heat sources. Geothermal warmth seeps up from Earth’s crust. Friction adds more as the ice sheet slowly scrapes over bedrock.
Meltwater pools in bedrock hollows, sometimes linking into networks that move water across vast distances.
When those reservoirs drain suddenly, sliding can speed up along a flowline. When they stay full, pressure can shove water into new paths.
Not all lakes are active. Some large basins, like Lake Vostok beneath East Antarctica, appear stable. Vostok likely holds thousands of cubic kilometers of water under four kilometers of ice.
If a giant stable lake were to drain, the impacts would ripple from glacier stability to ocean circulation and ecosystems, with global sea-level consequences. That is why even “quiet” lakes matter in the longer view.
New pathways beneath the ice
The new work does more than dot the map with fresh blue circles. It links many of them.
The team identified five interconnected lake networks, revealing that pulses in one basin can trigger responses downstream.
That coupling helps explain why surface changes sometimes appear far from obvious sources. It also shows that a single lake’s behavior cannot be read in isolation; context matters.
Missing piece in ice models
Today’s ice sheet models do not routinely simulate subglacial hydrology. They capture snowfall, melting, and ice flow, but often assume a simple, static bed. The Leeds team wants to change that.
“The numerical models we currently use to project the contribution of entire ice sheets to sea level rise do not include subglacial hydrology,” Wilson said.
“These new datasets of subglacial lake locations, extents, and time series of change, will be used to develop our understanding of the processes driving water flow beneath Antarctica.”
Improving sea-level predictions
CryoSat’s long, consistent record is part of the shift from snapshots to movies. With each new cycle captured, models can be tuned and tested against reality.
That improves confidence in how the Antarctic Ice Sheet will respond to warming oceans and changing snowfall in the decades ahead.
“This research again demonstrates the importance of data from the CryoSat mission to improve our understanding of polar regions and particularly the dynamics of ice sheets,” Wilson said.
“The more we understand about the complex processes affecting the Antarctic Ice Sheet, including the flow of meltwater at the base of the ice sheet, the more accurately we will be able to project the extent of future sea-level rise.”
What’s ahead for the ice
The immediate task is to keep watching. Some lakes switched size between cycles. Others joined or left networks. Those shifts hint at evolving channels carved and closed by pressure, sediments, and ice deformation.
Future satellite missions with even sharper vision can catch shorter, subtler pulses. Airborne surveys and, one day, subglacial probes could ground-truth the patterns.
“Subglacial hydrology is a missing piece in many ice sheet models,” Wilson said. “By mapping where and when these lakes are active, we can start to quantify their impact on ice dynamics and improve projections of future sea level rise.”
Antarctica’s base is not a frozen solid. It breathes in water. It drains it away. That hidden motion can set the tempo for glaciers and, over time, the ocean they feed.
By adding 85 active lakes and five new networks to the map, and by clocking a dozen full fill-and-drain cycles, this study turns a static picture into a living system – one we can now start to forecast with greater skill.
The study is published in the journal Nature Communications
—–
Like what you read? Subscribe to our newsletter for engaging articles, exclusive content, and the latest updates.
Check us out on EarthSnap, a free app brought to you by Eric Ralls and Earth.com.
—–


