New map reveals the locations of the largest gold deposits in the US
American gold output in 2024 adds up to a clear story. A handful of states deliver almost all of the country’s new metal, and one of them towers over the rest.
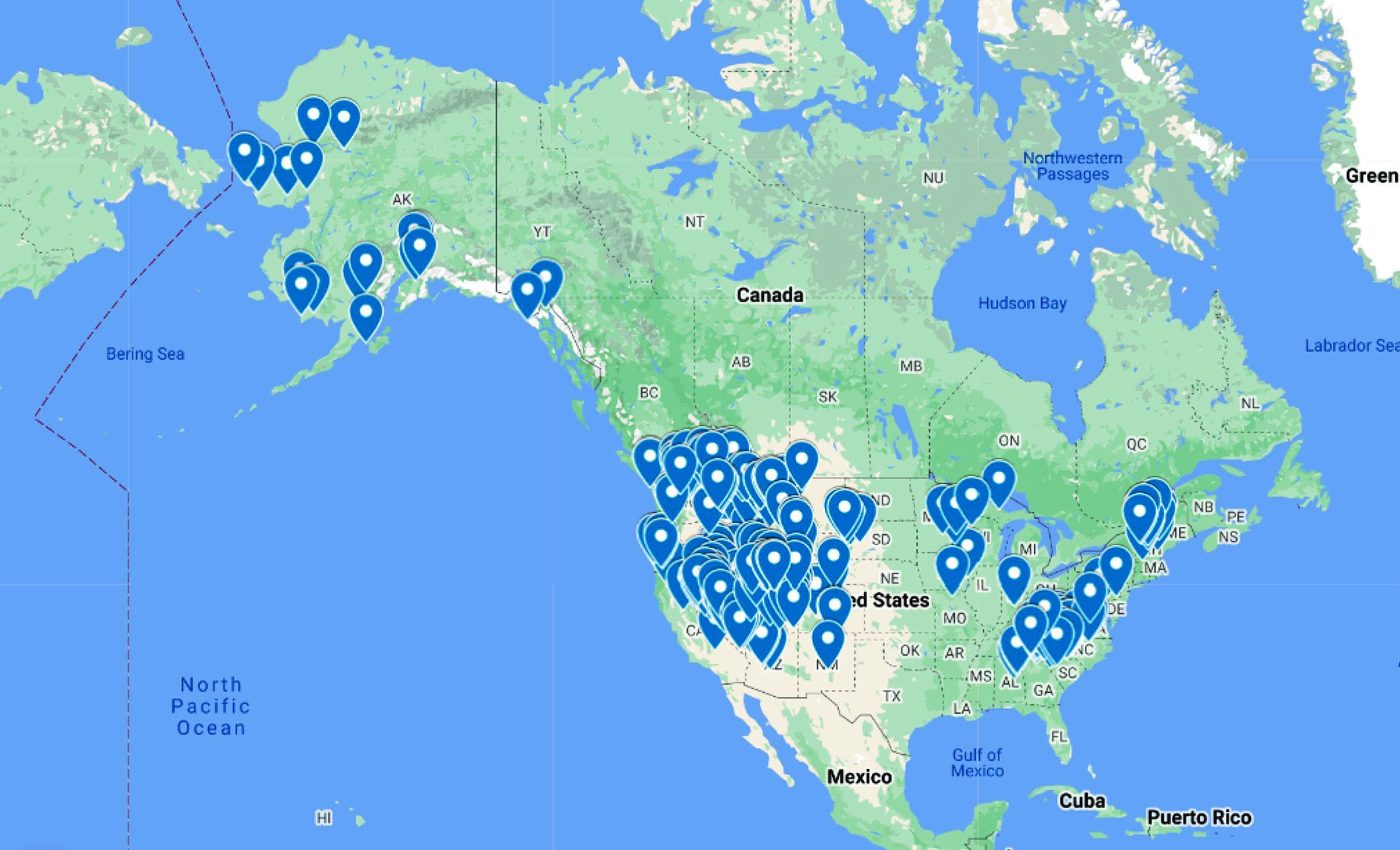
Gold came out of more than 40 lode mines and several placer operations, with the biggest concentration in the West and in Alaska.

The largest 26 mines supplied nearly all domestic production by volume, and commercial metal flowed through roughly 15 refineries.
Why a few states lead
This update comes from the U.S. Geological Survey’s Mineral Commodity Summaries 2025, prepared by Kristin N. Sheaffer. The data build a consistent picture of where U.S. gold begins its journey and why.
A lode deposit is gold locked in rock, while placer deposits are loose grains concentrated by water. Both occur across the West, but their scale and geology are not evenly distributed.
Nevada hosts a unique cluster of deposits known collectively as the Carlin Trend, a belt rich in microscopic, disseminated gold. The scientific description of this deposit type and district has shaped modern U.S. production.
Nevada’s outsized role
Nevada is the top producer, accounting for about 70 percent of U.S. mine output, with Alaska in second place at about 16 percent.
Nevada’s concentration of Carlin-type deposits allows large, efficient open pit and underground operations. The state’s mining infrastructure, workforce, and long permitting experience add to its advantage.
Employment across U.S. gold mine and mill sites was about 12,000 workers in 2024. That figure reflects how production is concentrated in a small number of very high throughput operations.
Alaska steps up
Alaska’s second place standing comes from a mix of hard rock and large scale placer mining. The state’s remote settings and logistics make operations complex, but the resources are significant.
Explorers and producers in Alaska also encounter systems linked to copper, where gold can occur alongside other metals. Those geologic ties matter for long term supply planning.
The United States holds an estimated 33,000 tons of identified and undiscovered gold resources, and nearly one quarter of the undiscovered portion is thought to be in porphyry copper deposits.
That estimate highlights why the West and Alaska remain in focus for the next wave of projects.
Price, demand, and recycling
“Gold once again dominated headlines in 2024, with prices reaching 40 record highs last year,” said Louise Street, a Senior Markets Analyst at the World Gold Council.
Gold prices set a string of records in 2024, and market watchers noted the turn in investor behavior late in the year.
The average U.S. government estimate for 2024 was about 2,400 dollars per troy ounce, up roughly 23 percent from 2023. That price strength weighed on jewelry volumes but lifted the dollar value of demand.
Global use of newly mined and recycled gold breaks down mainly into jewelry, investment, and official sector channels.
In 2024, jewelry accounted for about 45 percent of global consumption, central banks and other institutions about 21 percent, physical bars 19 percent, coins and medals 7 percent, and electronics 6 percent.
On the home front, about 90 tons of new and old scrap were recycled in 2024, equal to roughly 45 percent of reported U.S. consumption. The domestic recycling supply slipped about 6 percent compared with 2023.
Global context
Worldwide mine production in 2024 came in at nearly 3,300 tons. China, Russia, Australia, Canada, and the United States were the top five producers in descending order.
The U.S. resource base is far larger than current annual output. Identified resources plus estimates of undiscovered resources together suggest multi decade potential, though timing depends on economics, permitting, and technology.
The government also maintains a large gold reserve for monetary and historical reasons. The Treasury records its gold at a statutory book value of 42.2222 dollars per troy ounce.
From mines to market
Gold does not go straight from a pit to a ring or a circuit board. About 7 percent of U.S. supply is recovered as a byproduct of processing domestic base metal ores, chiefly copper, and then refined into high purity metal.
Fabricators turn refined gold into jewelry, bars, coins, and components. U.S. jewelry manufacturing clusters in New York, New York, and Providence, Rhode Island, with smaller hubs in California, Florida, and Texas.
Import and export flows round out the market. In recent years Switzerland and Canada have been key partners for bullion, while Mexico and Colombia have been major sources of dore (the semi-refined alloy shipped to refineries).
What this means for the map
If you trace the nation’s gold back to its source, Nevada dominates the picture. Alaska contributes a significant share, and a few other Western states add smaller streams.
The rest of the system, from refineries to fabrication hubs, keeps the metal moving even when mine output shifts. Costs, prices, and investment patterns will keep shaping where the next ounces come from.
—–
Like what you read? Subscribe to our newsletter for engaging articles, exclusive content, and the latest updates.
Check us out on EarthSnap, a free app brought to you by Eric Ralls and Earth.com.
—–


