Earthquake in the Cascadia region could flood the coast under six feet of water in minutes
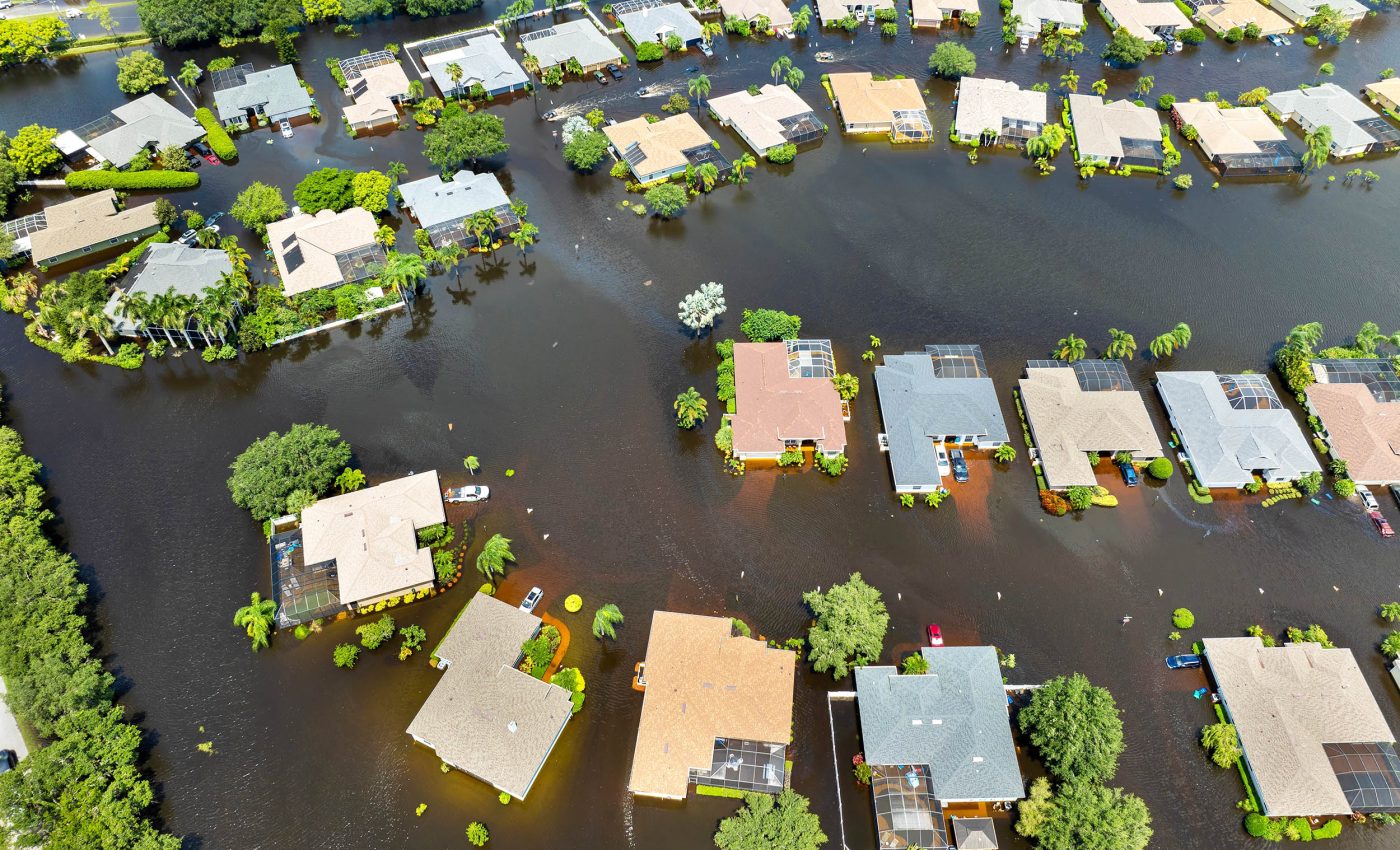
The Pacific Northwest sits next to a powerful tectonic boundary called the Cascadia Subduction Zone. When strain builds and the boundary slips during a great earthquake, the land along parts of the coast in the Cascadia region can flood, sinking under several feet of water.
The flood waters would then move farther inland – not because the sea level suddenly rises, but because the ground suddenly drops.

That one shift sets up a long, significant problem that manifests in high tides, storms, and the places people live and work.
Flooding during a Cascadia region earthquake would alter the topography and ecosystems of the coastal region for years to centuries.
For that reason, modeling the potential destruction helps agencies guide where to place homes, roads, and critical services that need to keep running during emergencies.
Cascadia flooding and “subsidence”
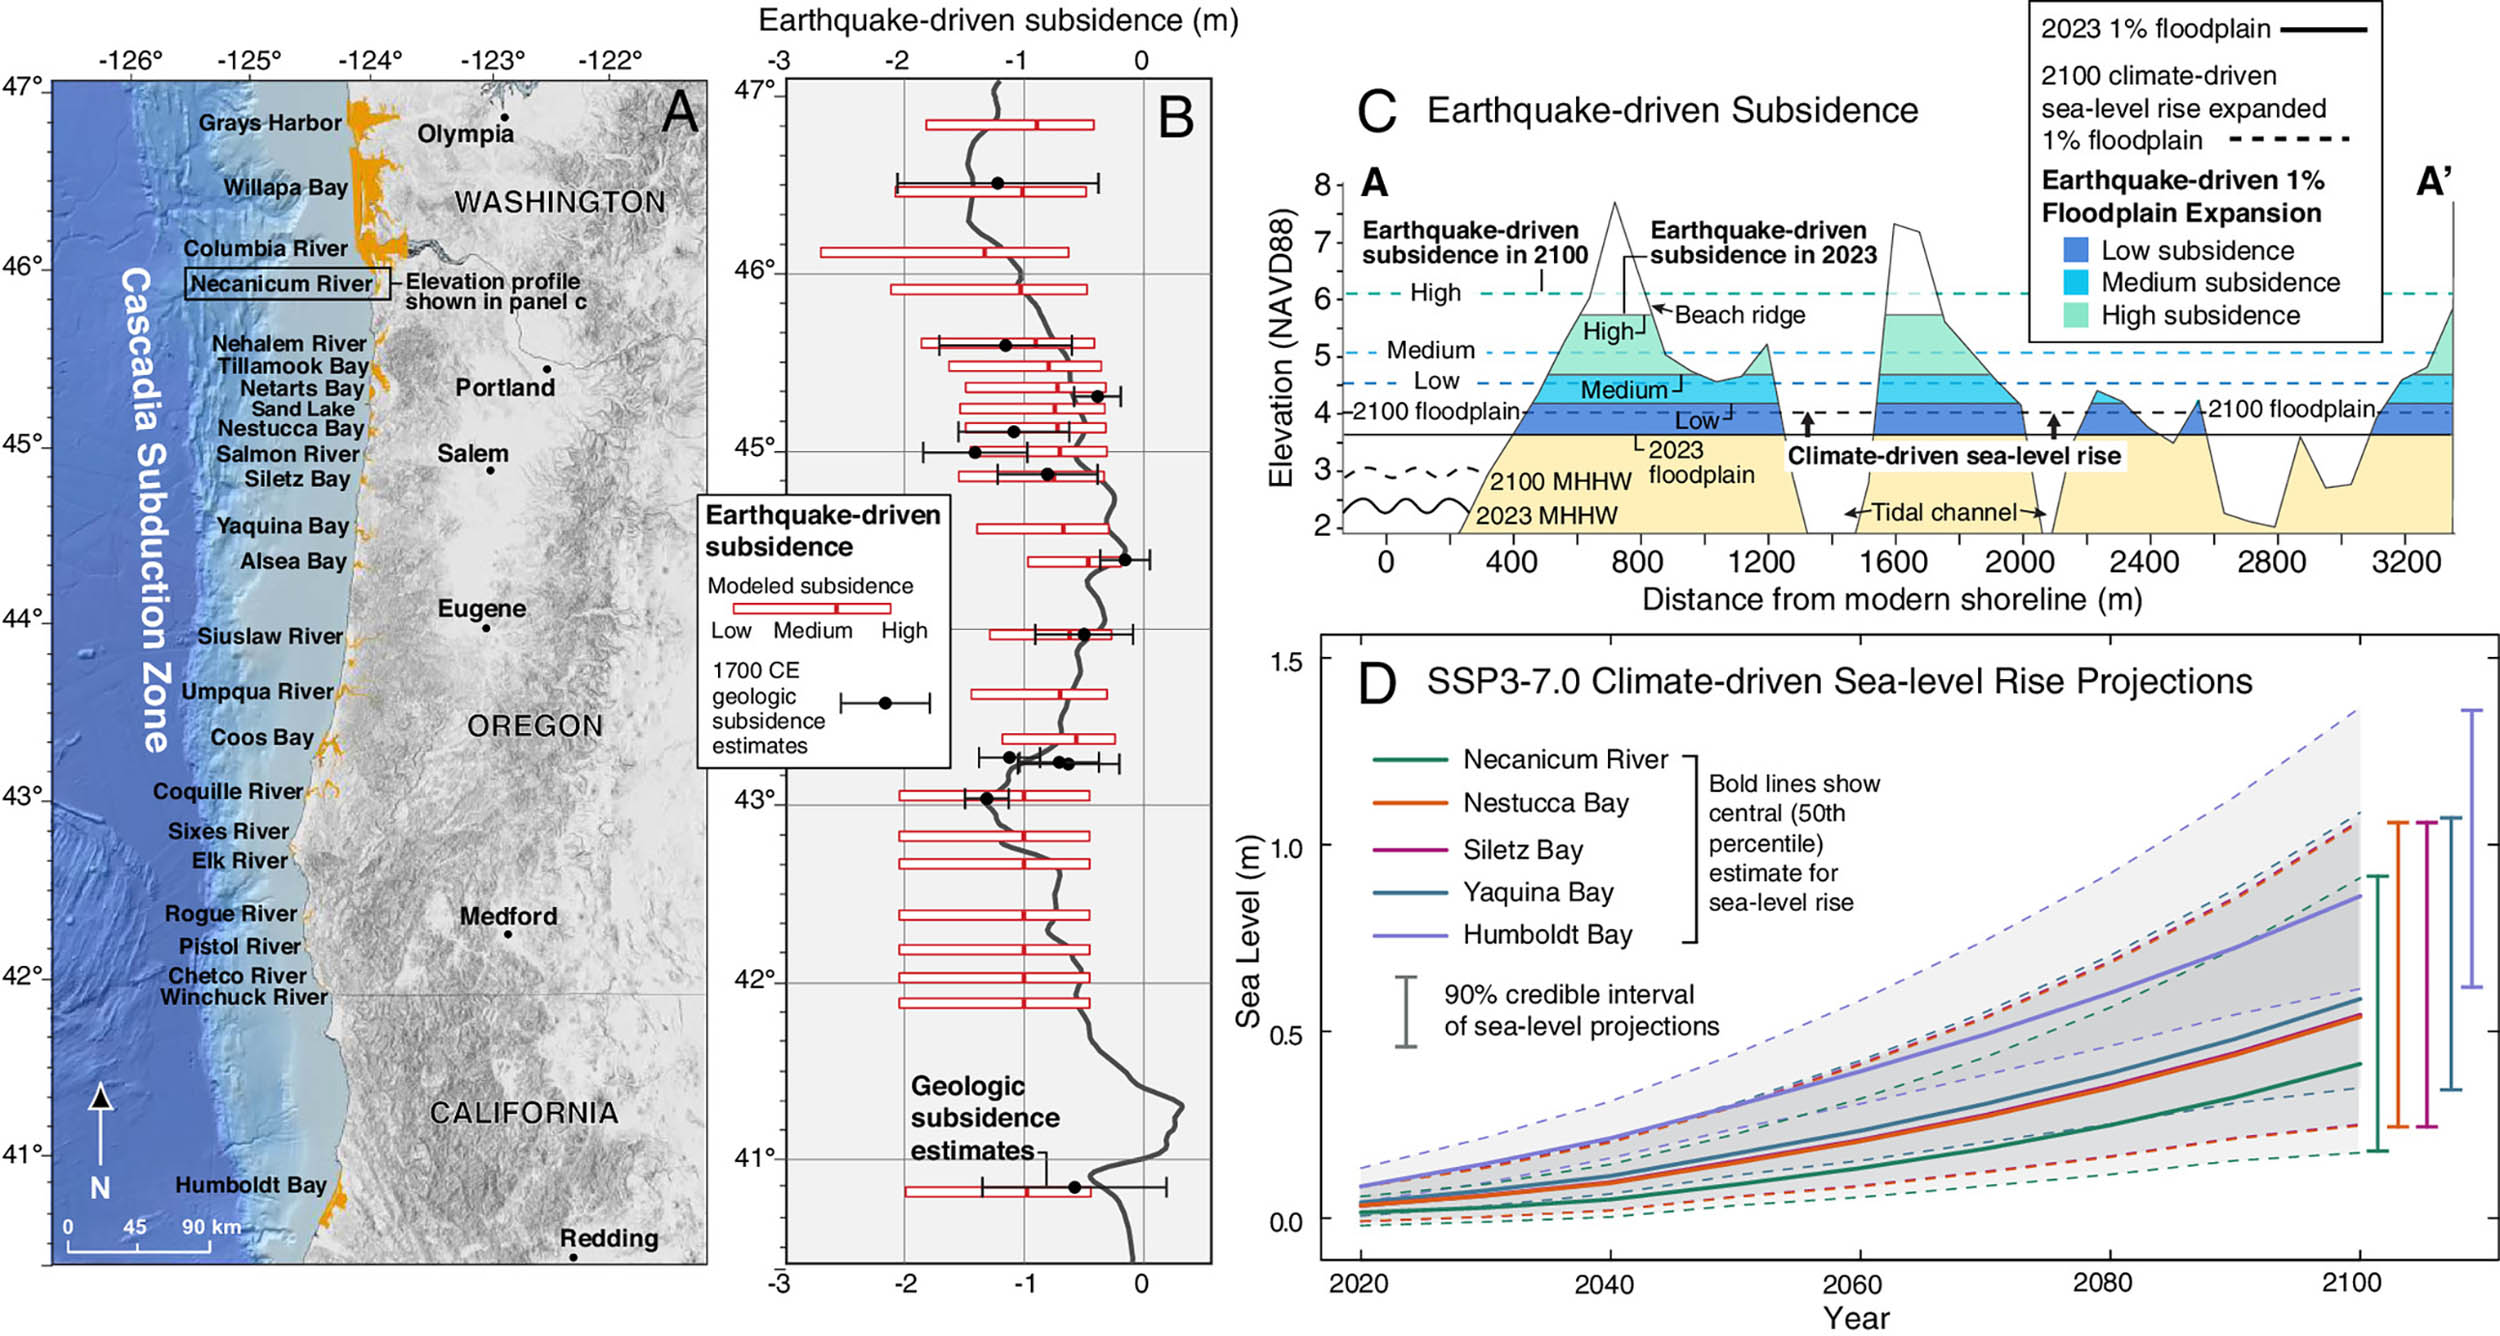
Geologists use the term “coseismic subsidence.” It means the land surface drops during the quake itself. In some locations along this coast, the study finds the ground could fall by at least 6.5 feet in one event.
That is enough to push everyday tidal water and storm surge inland, even before anyone talks about future climate change.
Maps that mark the “1% annual chance floodplain” get a lot of attention because they influence building codes, insurance, and emergency planning. The phrase describes the area with a one-in-one-hundred chance of flooding in any given year.
When the land sinks, that flood boundary moves. Places that used to sit just outside the mapped zone can end up inside that zone in a single day.
“The expansion of the coastal floodplain following a Cascadia subduction zone earthquake has not been previously quantified, and the impacts to land use could significantly increase the timeline to recovery,” said researcher Tina Dura, lead author of the study and assistant professor of geosciences in the Virginia Tech College of Science.
What the study measured
Researchers analyzed 24 estuaries – low, flat areas around river mouths where many people live, build roads, and maintain utilities.
They combined evidence from past Cascadia earthquakes with a wide set of simulations of possible future events to estimate how much the ground could sink at different spots.
The team then layered those sinking scenarios onto detailed elevation and land-use maps to see how today’s 1% boundary would change.
By focusing on the standard flood metric, the study connects its results directly to decisions that communities make every year. This approach shows how a single tectonic event can redraw flood risk in practical, mappable terms.
Cascadia flood zone growth
Under today’s sea level, the study finds that a great earthquake alone would expand the total 1% floodplain across the 24 estuaries.
In the mildest sinking case, the added area matches the footprint of a medium-sized city. In a middle case, the increase is larger. In a severe case, the added area multiplies several times beyond that.
These are not just empty marshes. They include neighborhoods, businesses, roads, and other infrastructure that rarely flood today but would start to see tidal or storm-driven water more often.
The key point is speed. The map changes in minutes, and the new pattern does not flip back the next day.
Higher seas expand floods
The study then stacks late-century sea-level rise on top of the one-time land drop and remaps the floods. The result is a much larger footprint.
In the most severe combined scenario, exposed population, structures, and miles of road jump compared with today’s baseline. The phrase for this effect is “compound hazard.”
Earthquake subsidence and sea-level rise do not cancel one another. They add together. That combined push exposes far more people and assets than either hazard by itself.
Subsidence is patchy. Local geology, distance from the fault, and the shape of each estuary all matter.
Some places might see only a modest drop. Others could lose several feet in one go. That patchwork decides which towns suddenly sit lower than the nearby water and which keep a margin.
Recovery is slow. Tectonic uplift and sediment that rivers deliver can rebuild elevation, but those processes take decades to centuries. That means the post-quake flood risk becomes a long-term condition, not a short-term nuisance.
Sea-level rise vs. Cascadia flooding
Many current tools treat these hazards separately. Tsunami maps might include earthquake-related subsidence but skip future sea-level rise.
Flood maps might consider sea-level rise but ignore the one-time drop from a great quake. The study argues for integration so that communities are not blindsided by gaps between mapping systems.
Emergency operations centers, hospitals, wastewater plants, ports, and key bridges have to work when everything else falters. Placing them in zones that could become routinely flood-prone after a quake sets up cascading failures.
Updating zoning, elevating critical equipment, revising evacuation routes, and hardening roads are reasonable steps once the compound picture appears on a single map.
Incorporating nature in the plan
Healthy tidal wetlands can slow waves, store water during high-water events, and trap sediment. They also store carbon.
Those benefits matter, but wetlands are not invincible. If subsidence and sea-level rise outpace sediment buildup, wetlands can drown and convert to open water.
Protecting migration space and restoring areas that can keep up with rising water through sediment accumulation become part of a practical plan. These natural buffers reduce risk while supporting habitat.
People often mix up probabilities with calendars. The “1% annual chance flood” is a probability that resets every year. It is not a timetable. It is not “once every 100 years.” You could see multiple such floods in a short span or none for a while.
Lower the land after a quake and then keep lifting the water level through climate change, and the odds shift. Floods that used to be rare become more likely, water reaches farther, and damage costs rise.
Clarity on terms helps keep expectations straight and keeps plans aligned with actual risk.
Cascadia earthquake flood preparation
Plan for the coast as it will be, not as it used to be. Use compound-hazard maps that include the one-time drop from a great quake and the steady rise from climate.
Place new buildings and upgrades with those maps in hand. Reinforce the infrastructure that must stay put. Invest in natural buffers that buy time and reduce exposure.
“Today, and more so in 2100 as background sea levels rise, the immediate effect of earthquake-driven subsidence will be a delay in response and recovery from the earthquake due to compromised assets. Long-term effects could render many coastal communities uninhabitable,” Dura concluded.
A great Cascadia earthquake does more than shake the ground and possibly send a tsunami. It can reset the shoreline baseline in minutes. Once that baseline drops, higher seas magnify the problem.
Acting on that knowledge now helps make sure today’s safe ground does not turn into tomorrow’s chronic flood zone.
The full study was published in the journal Proceedings of the National Academy of Sciences.
—–
Like what you read? Subscribe to our newsletter for engaging articles, exclusive content, and the latest updates.
Check us out on EarthSnap, a free app brought to you by Eric Ralls and Earth.com.
—–


