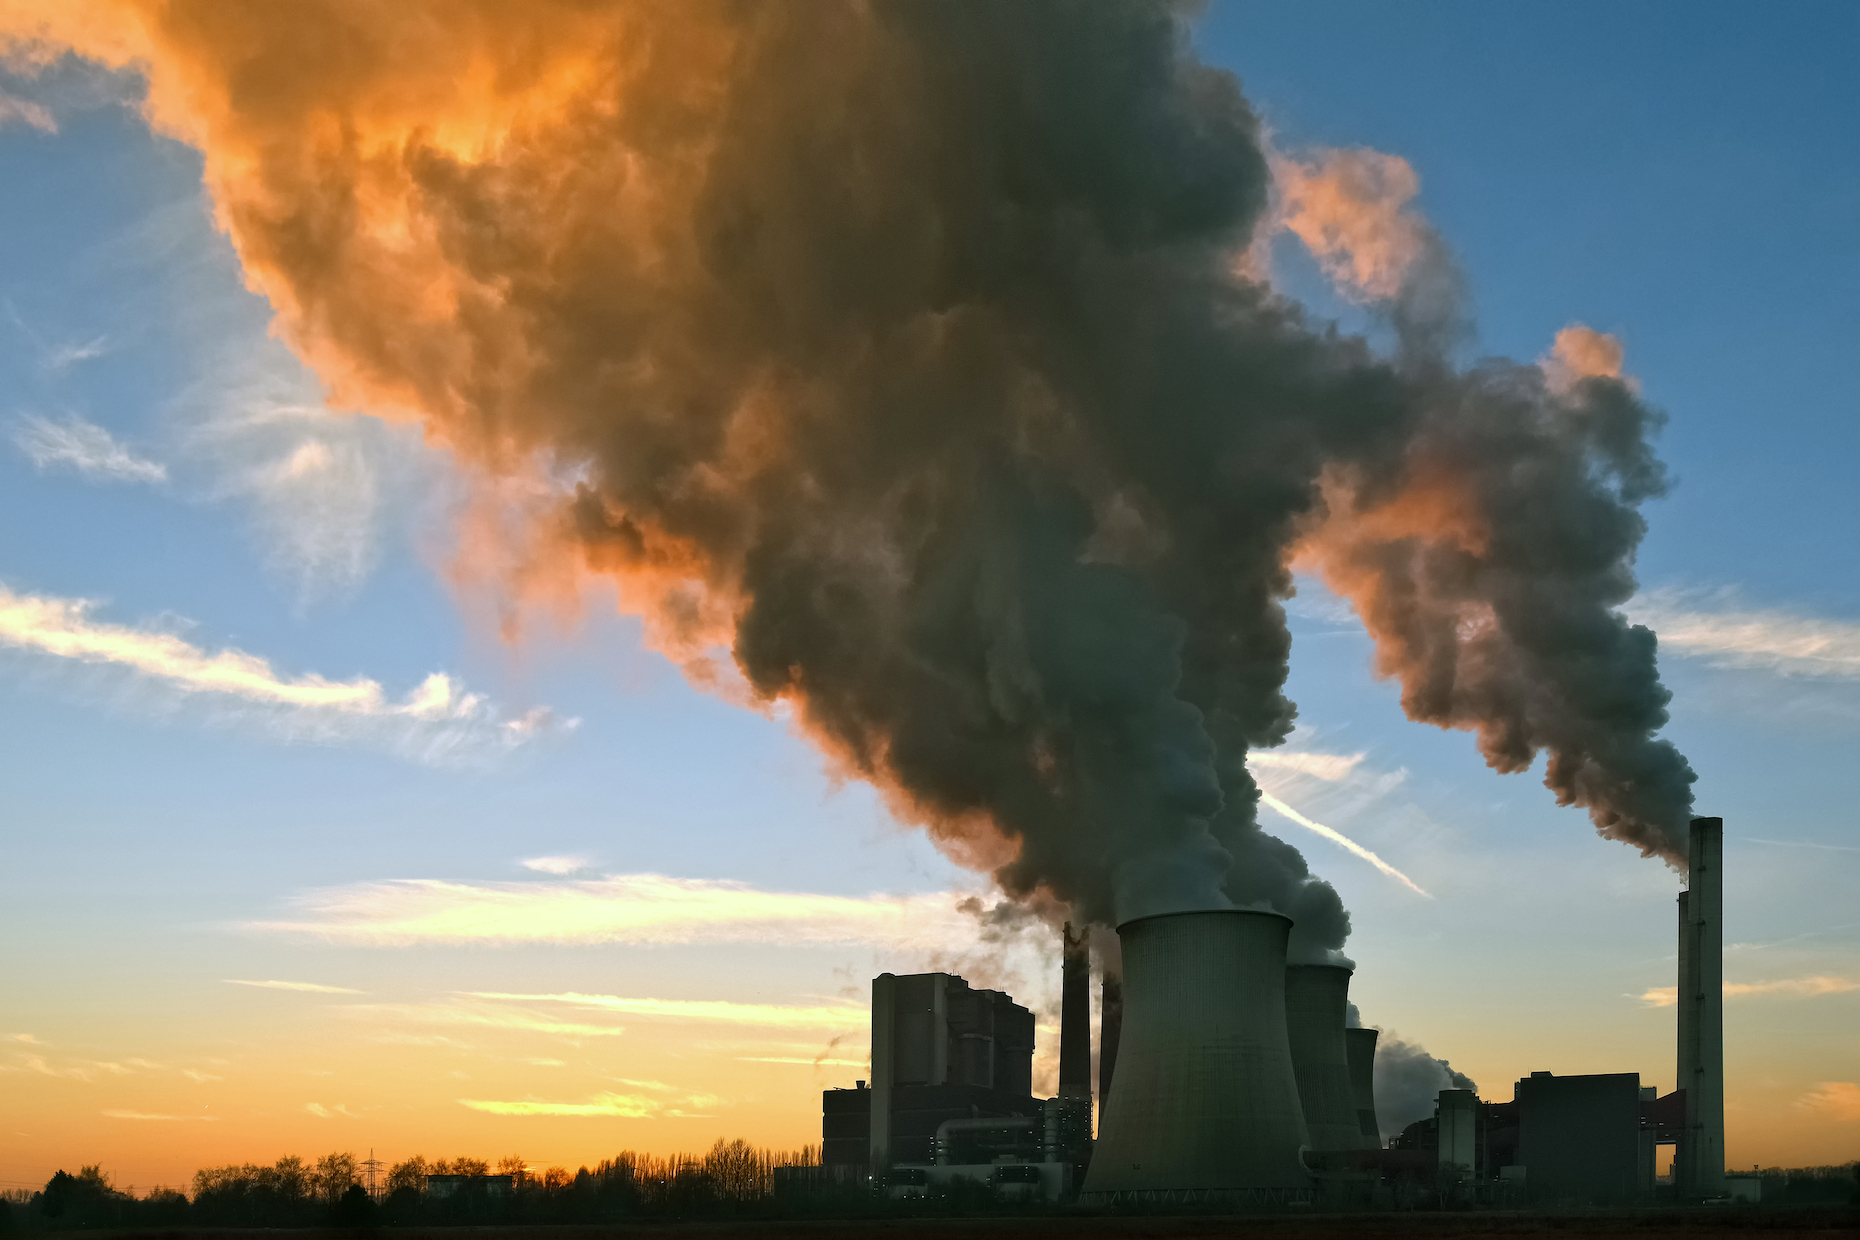
Global CO2 emissions stalled for the third straight year
A global analysis of greenhouse gas (GHG) emissions has revealed that CO2 levels have stalled for the third consecutive year. While CO2 emissions are still the most predominant, these emissions slowed down in 2012 and stalled over the three years that followed.
The assessment, which is conducted by the European Commission Joint Research Centre (JRC) and the Netherlands Environmental Assessment Agency (PBL), is based on the continuous monitoring of carbon dioxide (CO2), methane (CH4) and nitrous oxide (N2O) across the globe.
The study showed that Russia, China, Japan, and the United States continued to lower CO2 emissions. Emissions in the European Union (EU) remained the same as the previous year, and India’s emissions continued to increase.
While the main source of CO2 emissions is industry, the primary source of CH4 and N2O emissions is agriculture. Because data on energy-related activities is updated more often than data on agricultural activities, levels of methane and nitrous oxide are only available up until 2012 in the report.
In addition to not being released as frequently, measurements of CH4 and N2O emissions are also not as precise as estimates of fossil carbon dioxide emissions. Data through 2012 shows a steady increase in overall global GHG emissions, with an increase of 91 percent from 1970 to 2012.
In the EU, six countries account for 60 percent of the CH4 and N2O emissions – Germany, UK, France, Poland, Italy and Spain. The rise in methane and nitrous oxide emissions is also apparent in the United States, China, Japan and India.
On the other hand, the EU has steadily decreased its CO2 emissions over the last two decades, which represent two-thirds of the EU’s total greenhouse gas emissions.
The evaluation is based on the JRC’s Emissions Database for Global Atmospheric Research (EDGAR), which is exceptional in its space and time coverage and also in its completeness and consistency of data on emissions of greenhouse gases, air pollutants, and aerosols. The report contains fact sheets for 216 countries that cover various emissions from 1970 to 2016.
—
By Chrissy Sexton, Earth.com Staff Writer


