NASA releases images showing the violent area around the Milky Way's central black hole
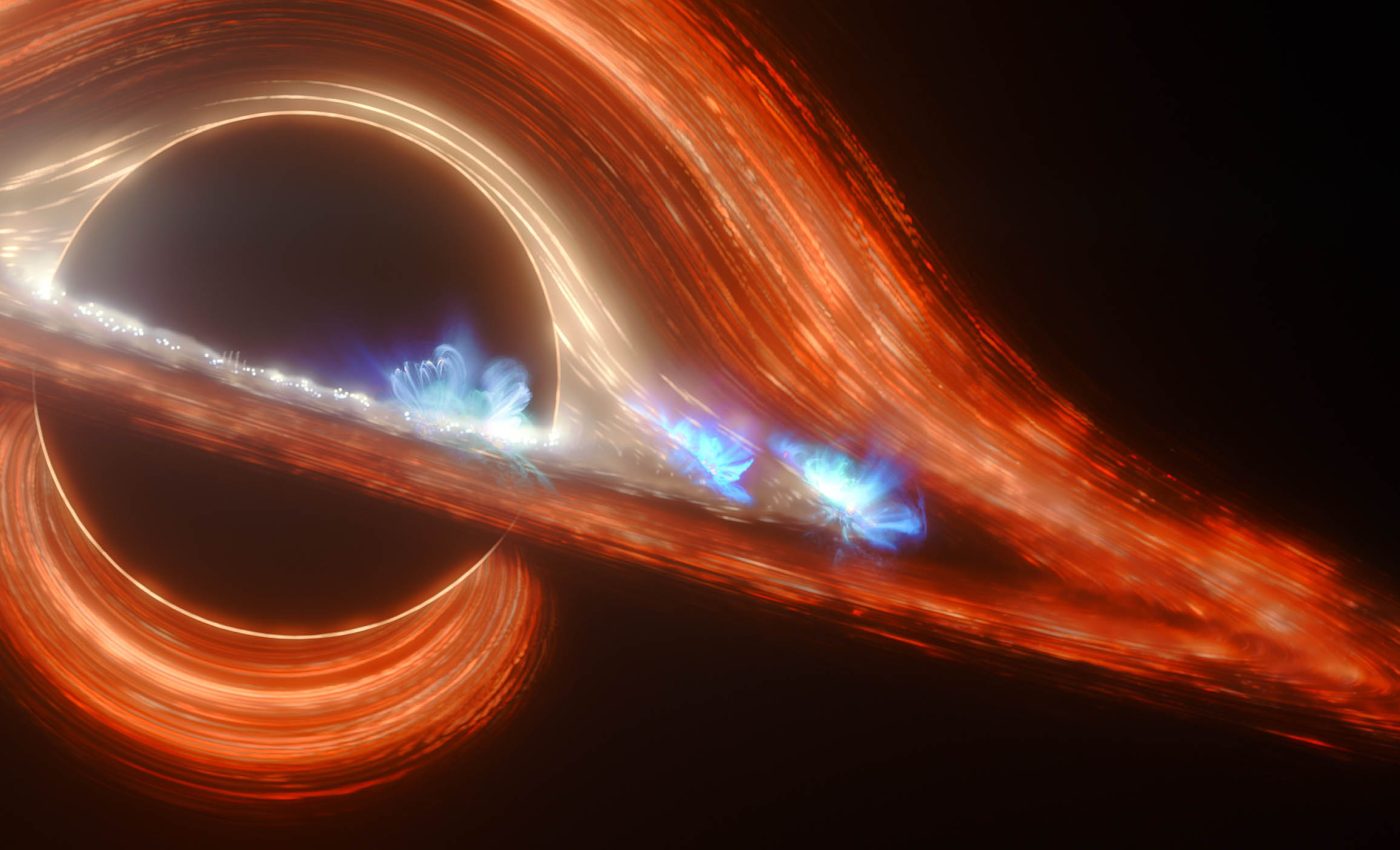
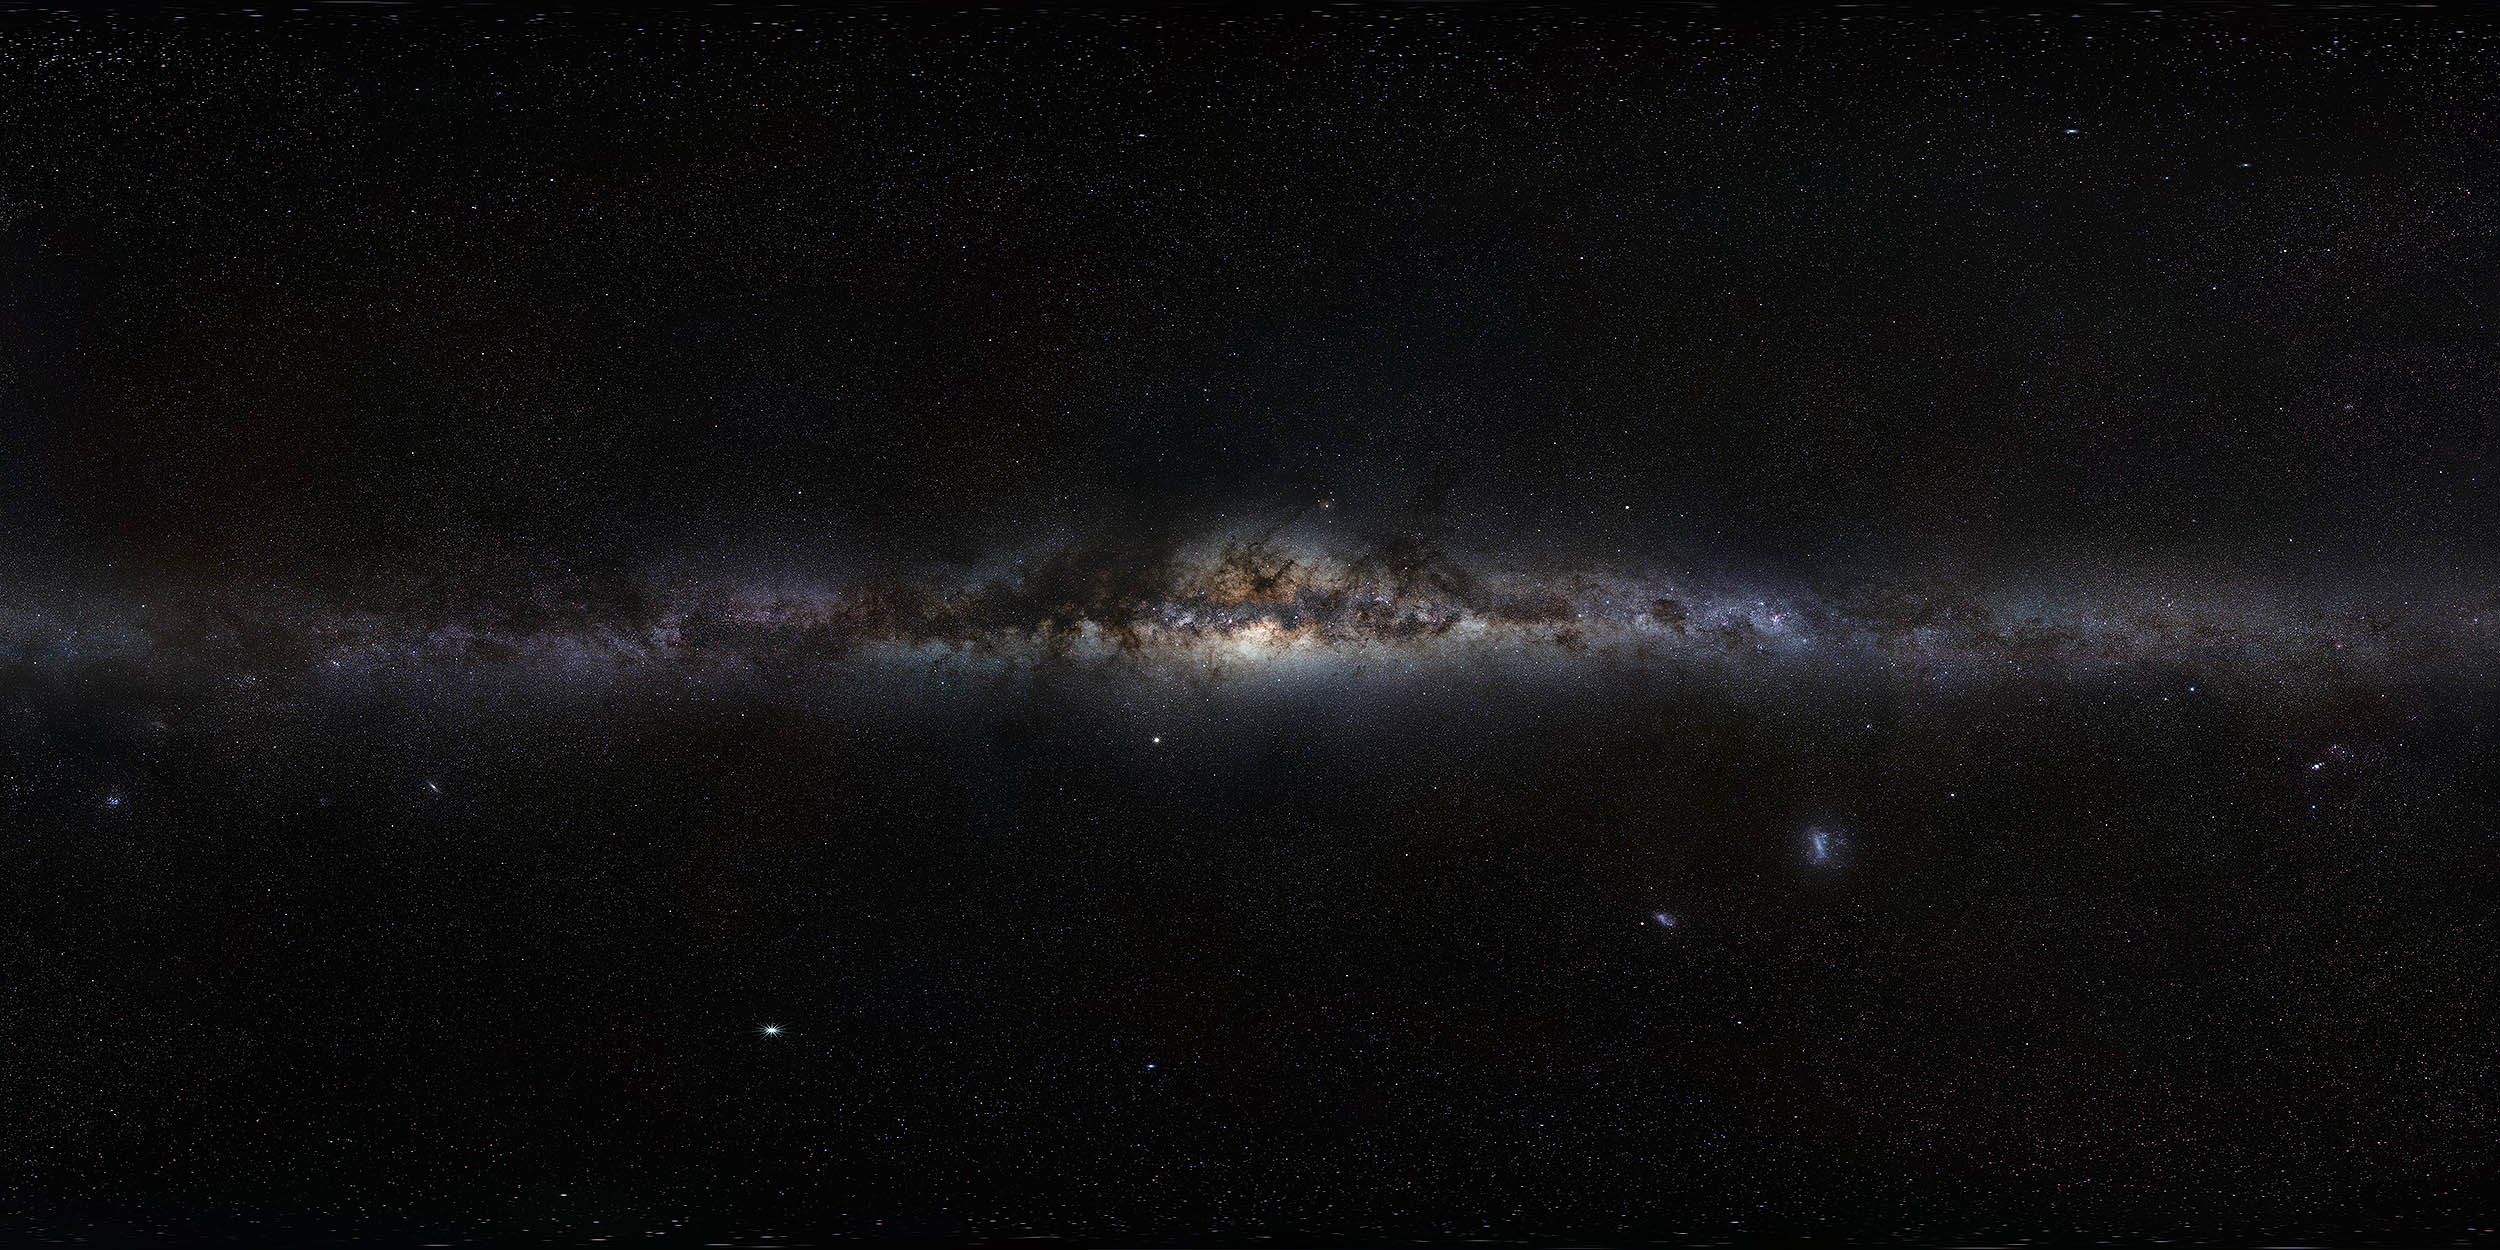
The center of our Milky Way galaxy is anything but calm. A supermassive black hole called Sagittarius A* (Sgr A*), about four million times the mass of the Sun, calls this crowded region home.
We can’t see the black hole itself, but we can watch hot, glowing gas whipping around just outside its “point of no return” – the event horizon.

Astronomers decided to track that glow second by second.
They watched how the light brightened and dimmed near the event horizon of Sgr A*, because those changes reveal what the gas and magnetic fields are doing in that extreme environment.
Webb telescope studies Sgr A*
To study this activity, the James Webb Space Telescope (JWST) used its Near-Infrared Camera (NIRCam) to look at Sgr A* in two infrared colors at the same time: 2.1 micrometers and 4.8 micrometers.
That two-channel view helps us separate small shifts in energy. During several observing sessions over the past two years, Webb collected about two full days of continuous data.
Those uninterrupted runs let the team build light curves, which plot brightness against time. The curves showed steady activity. The brightness flickered on very short timescales and, at intervals, jumped into stronger flares.
Two colors, tiny delays
Watching both infrared channels together gave a key clue. The two wavelengths rose and fell together, but not perfectly.
The shorter wavelength, 2.1 micrometers, usually changed first. The longer wavelength, 4.8 micrometers, followed after a short delay – sometimes a few seconds, sometimes tens of seconds.
This brief lag points to a clear picture. Near the black hole, electrons gain energy quickly and radiate more strongly at shorter wavelengths. As they lose energy, their emission shifts to longer wavelengths.
This process – charged particles spiraling along magnetic field lines at nearly the speed of light – is called synchrotron radiation.
Turbulence and reconnection at work
The data point to two layers of behavior near Sgr A*. First, we see constant, low-level variability – a “background” flicker driven by turbulence in the hot gas close to the event horizon.
Turbulence means the flow does not move in smooth, circular orbits. It pulls and stretches different regions of the flow, heating electrons and producing small, persistent changes in brightness.
Second, we see sharper flares. Twisted magnetic field lines can snap and reconnect as the flow churns. Magnetic reconnection releases stored magnetic energy into nearby particles, accelerating electrons in a burst.
Those energized electrons produce the brighter flares, and the timing and color changes of those flares match what Webb recorded.
The same mechanism powers solar flares, but the gravity and conditions around Sgr A* drive it to higher extremes.
Timing points to the edge
Short timescales matter here. For a black hole with a few million solar masses, matter orbiting just outside the event horizon completes an orbit in tens of minutes.
Webb saw rapid changes and inter‑wavelength delays on sub‑minute scales – comparable to the light‑crossing time of a region only a few black hole radii wide.
That timing ties the emission to gas very close to the event horizon, not to material far from the center.
Webb’s long, steady stares captured both the jittery micro‑variations and the larger outbursts in the same continuous sequences.
That coherence allowed the team to test physical models against a single, uninterrupted record instead of piecing together events later.
Two wavelengths confirm the physics
Measuring two wavelengths together gives us more than an extra data stream – it gives us a clock. When one channel consistently leads the other by seconds, the time order constrains how electrons gain and lose energy.
These timing data constrain the magnetic field and particle energies described above. Together, they show that the near‑horizon environment acts like a natural particle accelerator.
Overall, the picture is consistent. Gas shed by nearby stars drifts inward and forms a hot, magnetized flow around the black hole.
Turbulence sets the baseline variability. Periodic magnetic reconnection injects extra energy, speeds up electrons, and triggers bright flares.
This approach – watching the light curves instead of single snapshots – turns the region around Sgr A* from a static scene into an evolving system.
The timing and color together convert brightness flickers into measurements of particle energy, magnetic fields, and size.
Lessons from Sgr A* flares
The next step is to gather longer, continuous light curves that cover a full day. With that coverage, astronomers can search for subtler patterns, such as repeating orbital signatures or connections between infrared flares and X‑ray outbursts that may occur at the same time.
Even with the current dataset, Webb has changed our view of the source. Sgr A* no longer seems like a distant, mysterious “sometimes flaring” object.
With two carefully chosen infrared channels, long sequences, and second‑by‑second timing, it now appears as an active, magnetized flow that we can monitor as it evolves.
The full study was published in The Astrophysical Research Letters.
—–
Like what you read? Subscribe to our newsletter for engaging articles, exclusive content, and the latest updates.
Check us out on EarthSnap, a free app brought to you by Eric Ralls and Earth.com.
—–


