NASA creates an incredibly detailed map of Earth's seafloors from space
We know surprisingly little about Earth’s deep seafloor – only a small percentage has been mapped in detail. There are better maps of the Moon’s surface than of the bottom of Earth’s ocean.
Ships with sonar can trace depth with great accuracy, yet ship time costs money, runs at ship speed, and leaves wide gaps between tracks.

Satellites, on the other hand, can view most of the planet frequently. The Surface Water and Ocean Topography mission (SWOT), a partnership between NASA and the CNES, covers about 90 percent of Earth’s surface waters every 21 days between roughly 78°N and 78°S.
However, until recently, they ignored the small features that matter for geology and ocean physics.
As part of the ongoing effort, a NASA-supported team recently published one of the most detailed maps yet of the seafloor. Their new study shows what steady satellite observations can do when combined with careful physics.
How SWOT mapped the seafloor
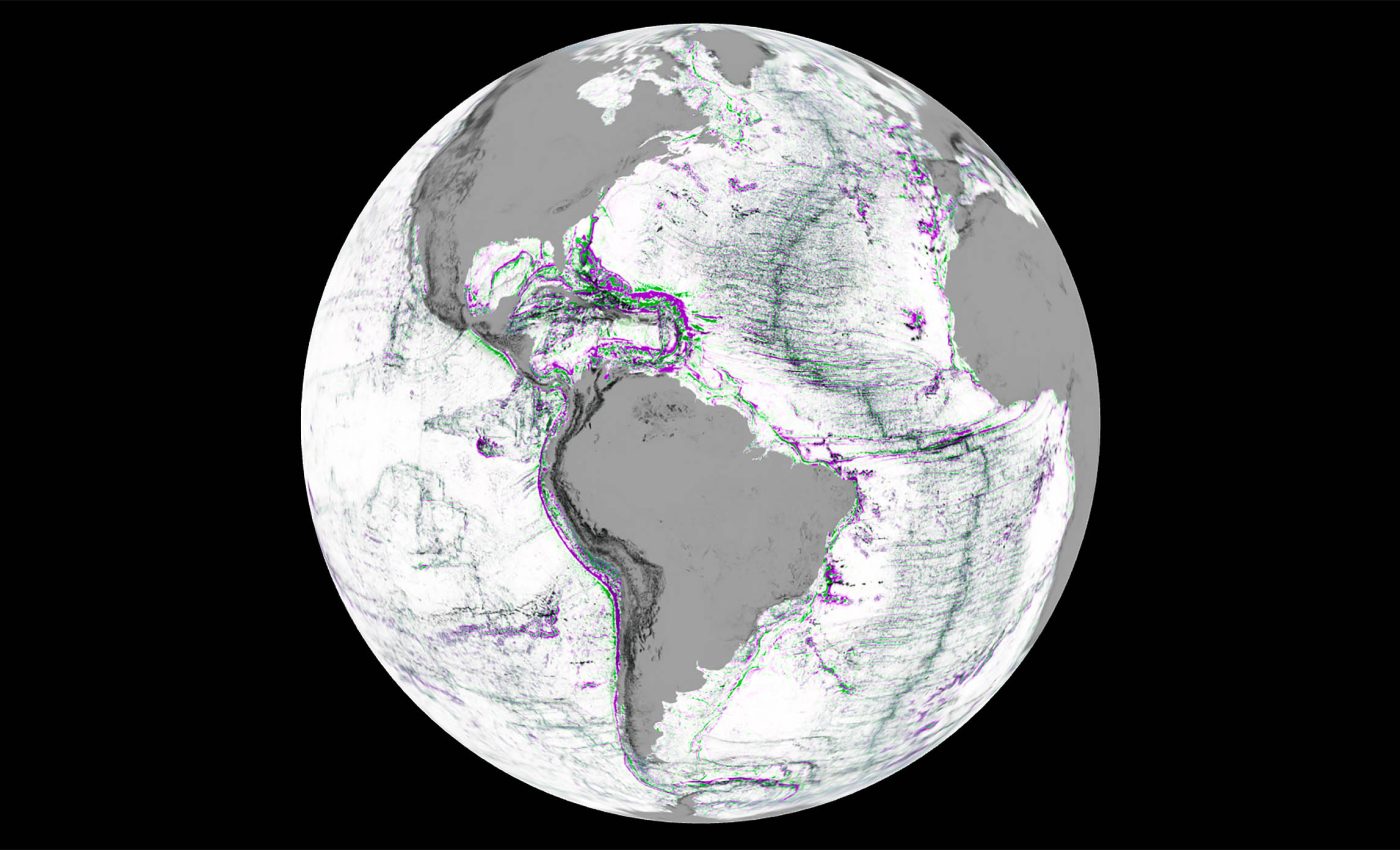
Using SWOT observations from April 2023 to July 2024, the new maps reveal deep‑ocean features that were mostly invisible before.
The satellite maps the height of the ocean in two dimensions with radar interferometry, which lets scientists see the smallest bumps and dips.
Underwater ridges and volcanoes contain more mass than nearby seafloor. More mass means a slightly stronger tug on Earth’s gravitational field.
That extra pull lifts the sea surface above those features by only a few hundredths to a few tenths of an inch (about 0.5–7 millimeters). SWOT can measure sea surface height with centimeter‑level accuracy.
Scientists then look for patterns in the “wrinkles” on the sea surface because they often sit above edges and rises on the seafloor. In that sense, SWOT “reads” the ocean’s surface to sense what lies below.
From height to gravity edges
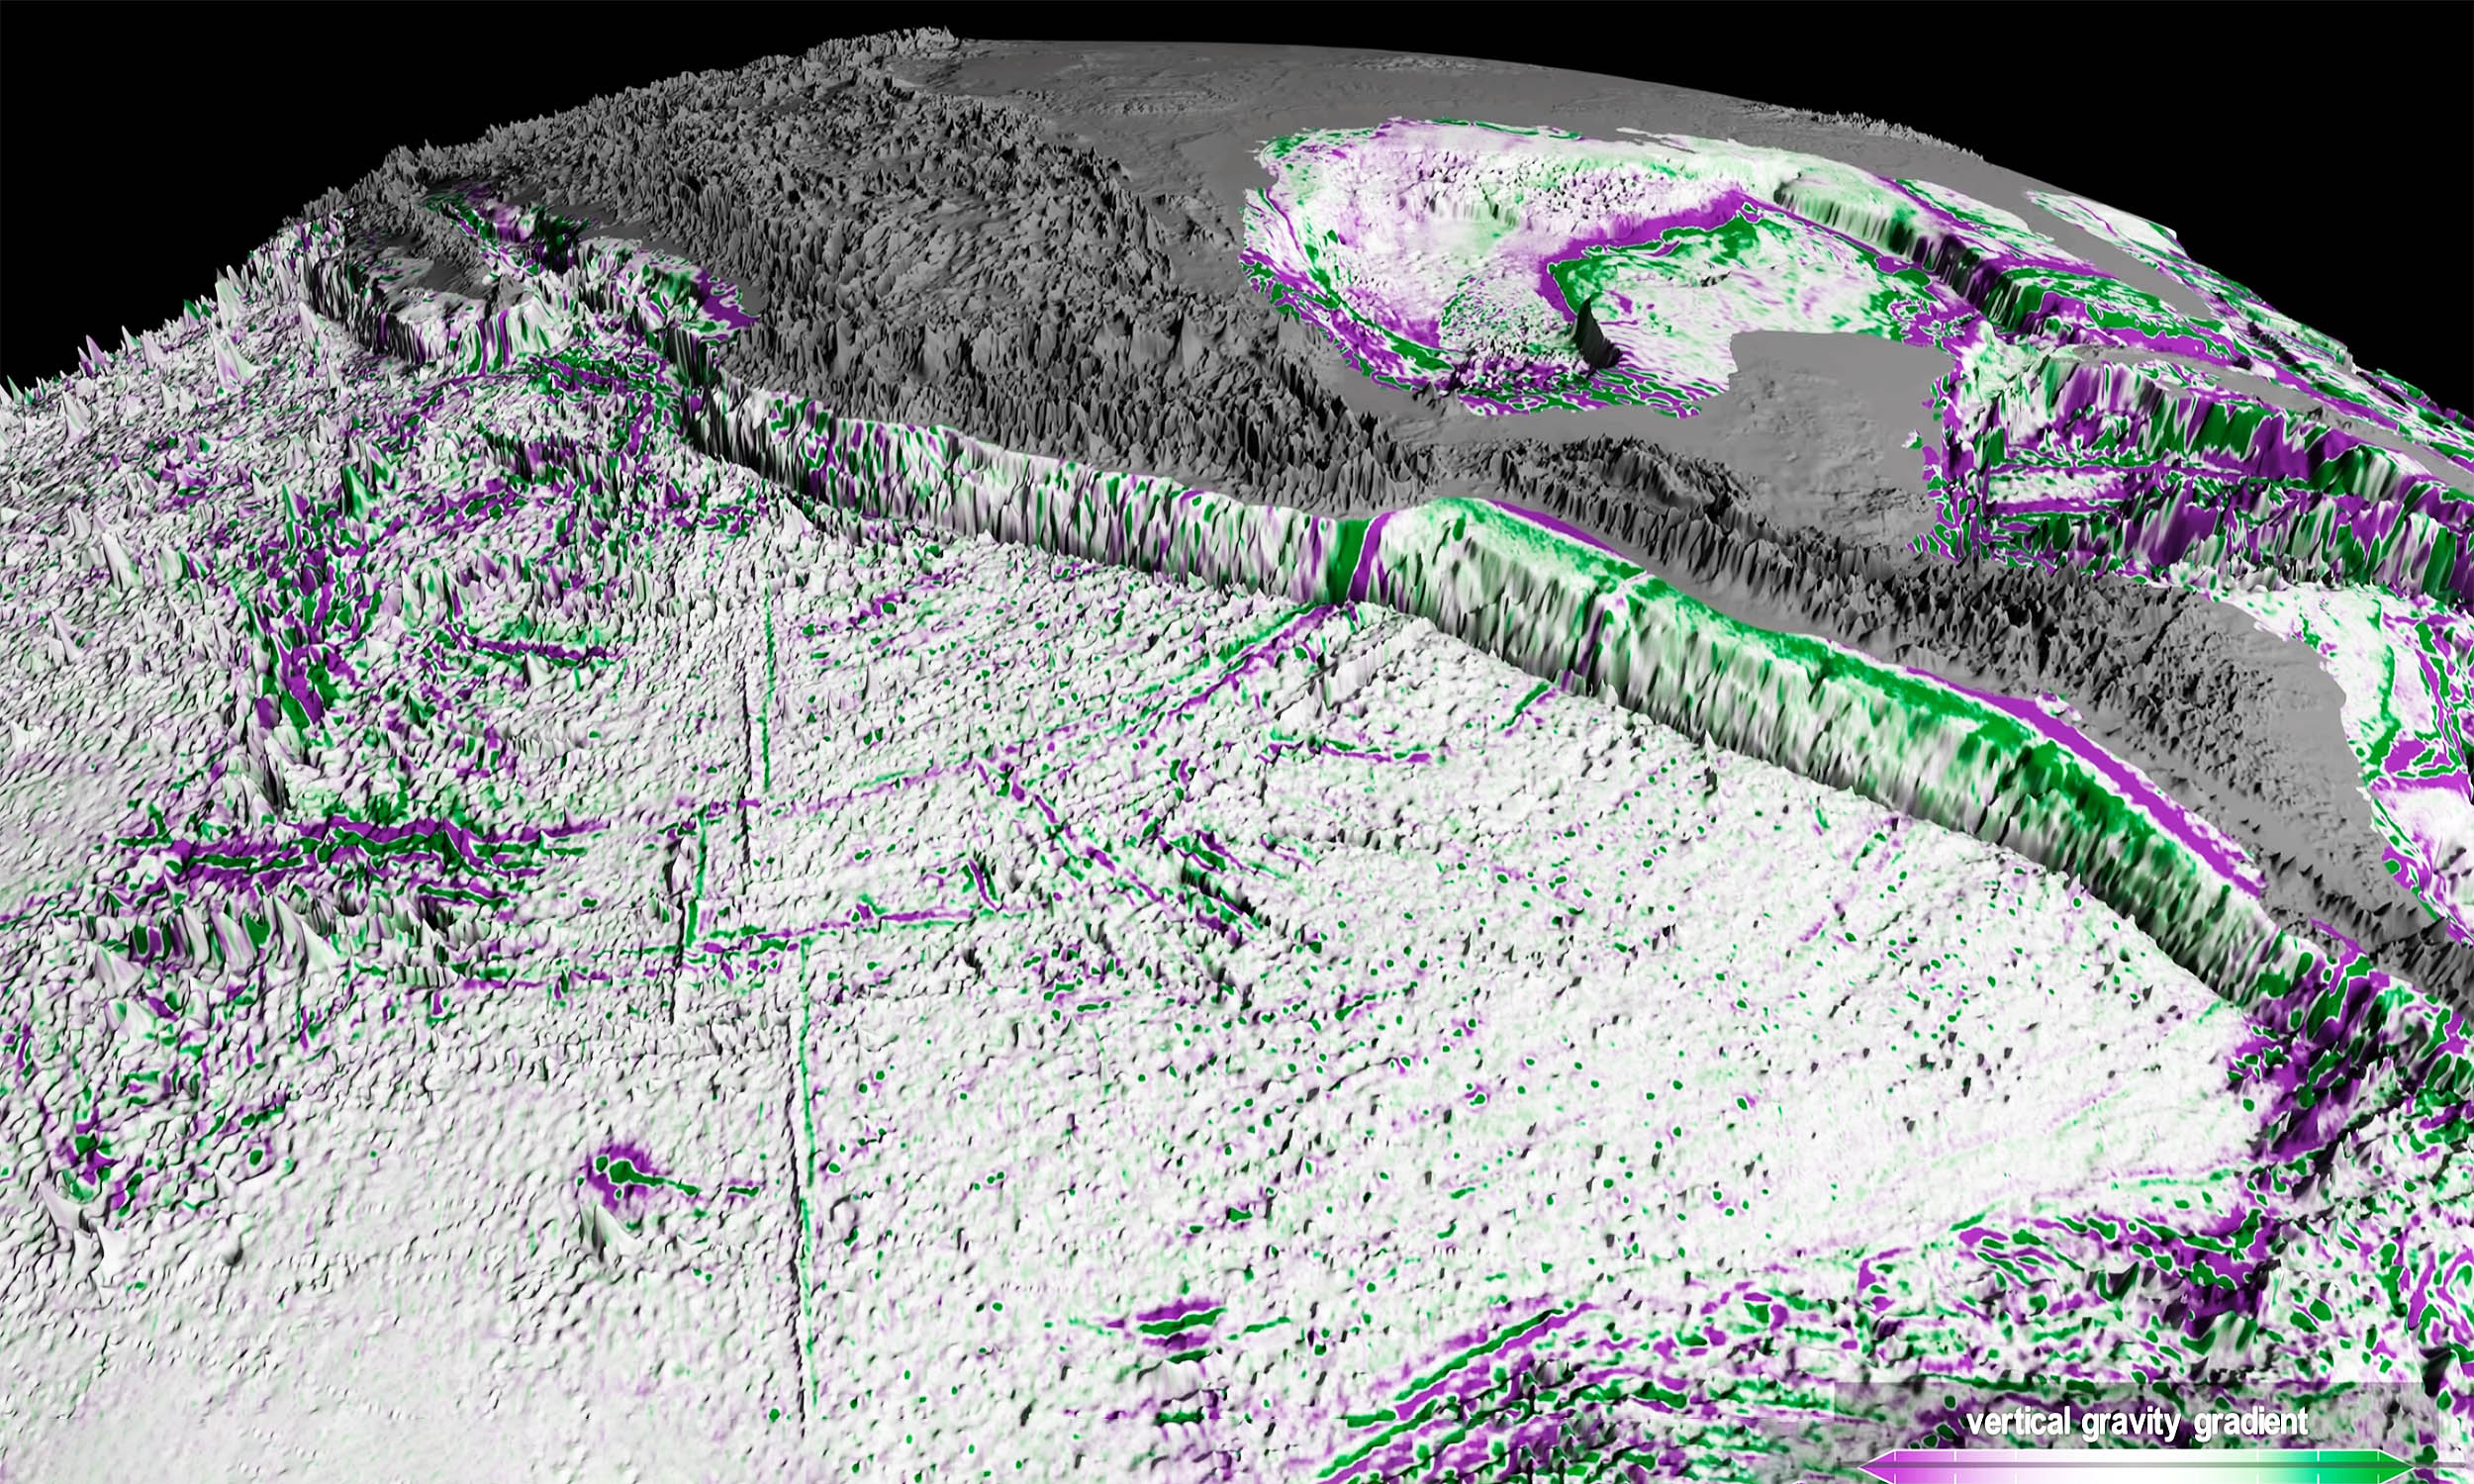
The team transformed the height data into a map of the vertical gravity gradient. That quantity highlights sharp changes in gravity, which tend to mark boundaries, ridges, and compact bumps.
The approach emphasizes short‑wavelength structure, so it brings small features into focus while leaving broad trends in the background.
Over the past three decades, nadir altimetry mapped marine gravity at resolutions of about 12–16 kilometers (7.5–9.9 miles), leaving many small features unresolved.
With the new analysis, the global gravity map can pick out features down to about 5 miles (≈8 kilometers) across. That jump in resolution turns faint hints into clear signals and fills in broad swaths of the ocean that never saw a modern ship survey.
Abyssal hills in the deep ocean
Abyssal hills cover huge areas of the deep ocean. They form as plates pull apart at mid‑ocean ridges and new crust cools and cracks. In ship‑mapped regions, researchers can trace their spacing and direction easily.
With the new global map, scientists can follow these hill fields across entire basins and watch their orientations shift from region to region.
Those alignments record the direction and speed of seafloor spreading over millions of years.
With a cleaner view of these patterns, geologists can refine reconstructions of past plate motions and test how changes in spreading rates shaped ridges, fracture zones, and volcanic chains.
Smaller seamounts and hidden scars
Undersea volcanoes stand out because their extra mass produces strong, compact gravity signals. Previous satellites reliably detected seamounts over roughly 1 kilometer (about 0.6 miles) tall.
SWOT can detect seamounts less than half that height, in areas where ships already mapped the bottom and confirm what the satellite is sensing through gravity.
Because small seamounts far outnumber large ones, the global inventory will grow as this information feeds into seafloor maps. That matters for basic volcanology and for practical tasks such as planning routes for seafloor infrastructure.
Continental margins, where shallow shelves drop into the deep ocean, often carry thick blankets of sediment. Those layers can mask older tectonic structures and river channels.
The gravity‑gradient patterns now reveal submarine canyons cut into shelves and hint at buried ridge‑and‑fault networks. These signals record how continents stretched, broke, or collided before sediments hid the evidence.
With a consistent view along many coasts, researchers can compare margins on different continents and piece together how ocean basins opened and evolved after plates split apart.
Mapping Earth’s seafloor matters
Seafloor roughness shapes deep currents and helps generate internal tides – waves that propagate inside the ocean rather than on the surface.
These waves mix water masses, steer heat and carbon, and influence how models simulate climate. When models know where the bottom is rough or smooth, they can represent that mixing more realistically.
Clearer gravity maps also guide safe routes for submarine cables and pipelines, inform tsunami and earthquake hazard work, and support navigation in poorly charted regions.
Fisheries research benefits as well, because seamounts and canyons can concentrate nutrients and marine life, creating productive hotspots.
Ships still set the depth
Satellite gravity does not replace ship sonar. Ships still measure true depth and provide the points that anchor every bathymetric chart. What SWOT supplies is the detail between the tracks.
That detail points ships to high‑value targets, whether a sharp ridge in a gap or an unexplored canyon that likely holds complex terrain.
As SWOT collects more repeat passes on its 21‑day cycle, random noise in the maps will fall, and even smaller features will stand out.
Researchers can merge the gravity information with existing depth soundings using modern statistical and machine‑learning tools to upgrade global bathymetry. That process produces maps that work better for navigation, ocean modeling, and hazard planning.
Mapping the seafloor with gravity
The central idea uses simple physics. Extra mass below nudges gravity above, and gravity lifts the sea surface by a tiny amount.
Measure those heights very precisely, convert them into gravity gradients, and you get a crisp portrait of edges and bumps on the seafloor.
With coverage that spans most of the globe and fine horizontal resolution, this first year shows how much hidden structure sat just out of reach.
The oceans cover most of our planet, yet the bottom stays out of sight. By listening to the sea surface and tracking its smallest tilts, scientists can map the invisible more fully.
The result is a clearer picture of abyssal hills that trace plate motion, compact seamounts that expand the volcanic record, and canyon systems that mark the boundary between continents and the deep.
The full study was published in the journal Science.
—–
Like what you read? Subscribe to our newsletter for engaging articles, exclusive content, and the latest updates.
Check us out on EarthSnap, a free app brought to you by Eric Ralls and Earth.com.
—–


