Milky Way captured in stunning detail from Southern hemisphere telescopes
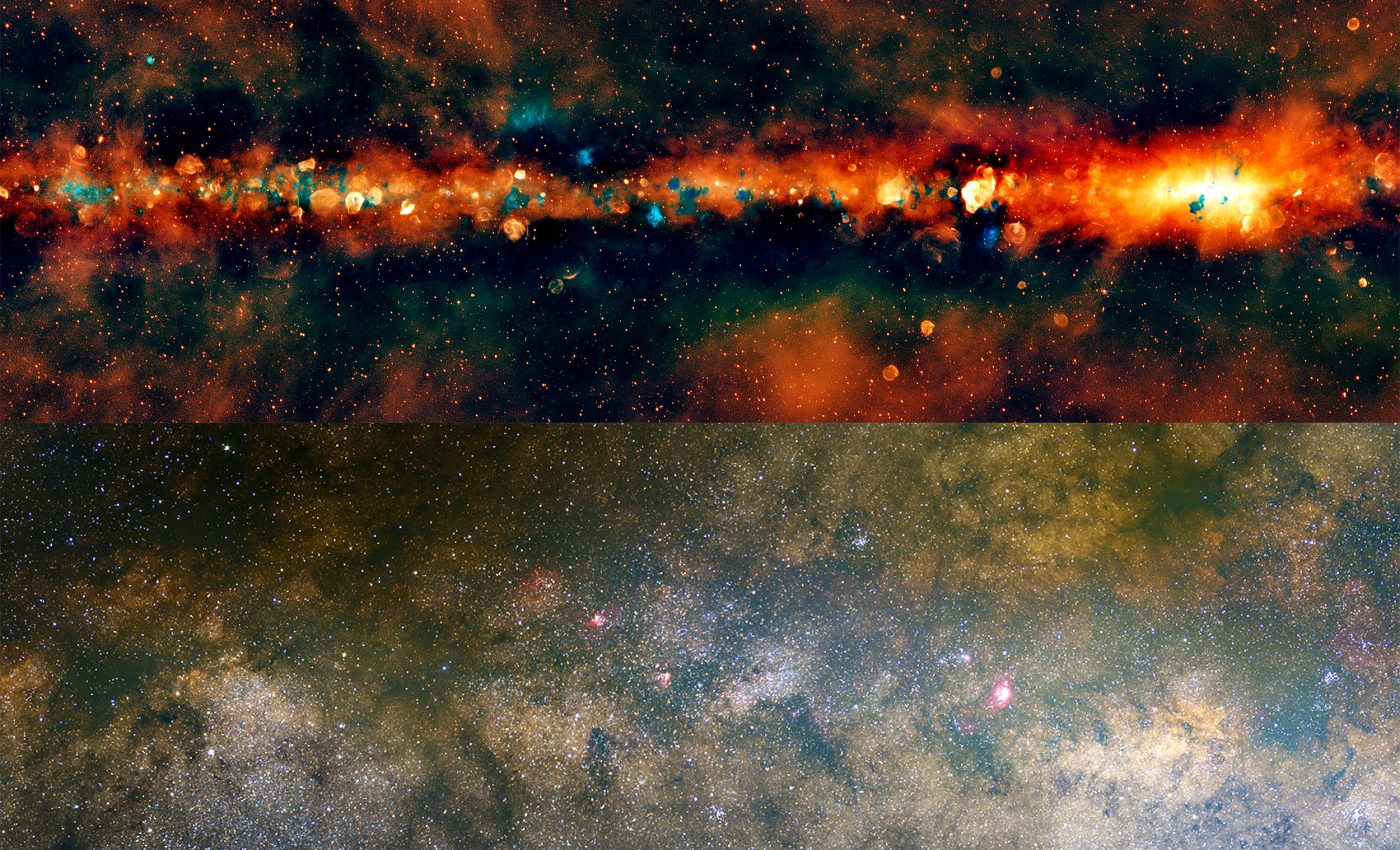
Astronomers stitched together a radio color map of the Milky Way that targets the southern stretch of its crowded midline. It captures low frequency structure across about 3,800 square degrees with crisp detail.
The work comes out of Western Australia, where an international team processed mountains of data from the Murchison Widefield Array (MWA). They turned it into a public image and a matched catalog for scientists, students, and the simply curious.
Radio color map of the Milky Way

“The final catalogue contains 98-207 radio sources,” wrote Silvia Mantovanini, the lead author at the International Centre for Radio Astronomy Research (ICRAR).
The image spans 72 to 231 megahertz and focuses on the Galactic Plane, the thin, star-filled midline of our Galaxy.
Colors in the picture are radio colors, not human vision. Each color channel encodes a separate chunk of the radio band to show how emission changes with frequency.
Source positions in the catalog are accurate to roughly an arcsecond, which helps with cross matching to optical and infrared surveys. Typical background noise lands around 3 to 6 millijanskys per beam in the wide band image.
Reliability and completeness were checked carefully. The team reports an overall reliability of 99.3 percent, with completeness benchmarks that vary by longitude because the plane itself is not uniform.
Creating a sharper view Down Under
The map relies on the Murchison Widefield Array, a low frequency radio telescope in Western Australia. Engineers expanded it in Phase II to reach finer angular detail and lower noise.
The Phase II upgrade doubled the longest spacing between antenna tiles, boosting resolution at these frequencies. Longer spacings separate small objects, while shorter spacings keep the wide glow.
To get both, the team combined older, wide angle data with the new high resolution observations using joint deconvolution. Deconvolution, a method to remove blurring from images, recovers faint structure without washing out detail.
That blend retains tiny knots and sprawling clouds in the same mosaic. It also preserves flux density, radio brightness per unit area, so measurements are fair and comparable.

Milky Way color radio frequency
At tens to hundreds of megahertz, most of the emission is synchrotron, radio light from fast electrons spiraling in magnetic fields. Those electrons trace shocks, turbulence, and the Galaxy’s magnetic backbone.
Some gas clouds called “H II regions,” zones of ionized hydrogen around young stars, absorb low frequency background light. This turns them into natural silhouettes that help map what lies in front of and behind them.
That absorption lets astronomers estimate the Galaxy’s emissivity, radio power per volume from charged particles. The approach was sharpened in a 2018 study that used exactly these frequencies.
Low frequency data also flag places where thermal gas blocks nonthermal light. That contrast helps separate supernova debris, star forming bubbles, and background galaxies that peek through the Galactic haze.
Finally, these bands are sensitive to steep spectrum sources. Many of those are either very old, very diffuse, or both, which makes them hard to see at higher frequencies.
Early science targets
Supernova remnants dot the plane like confetti and record how massive stars explode and stir their neighborhoods. A comprehensive 2015 review explains how radio spectra reveal shock acceleration and aging in these shells.
Patches of very blue radio color in this map often mark compact thermal regions. Those are good “H II regions,” cocoons around newborn clusters that also appear vividly in mid-infrared surveys.
The catalog’s spectral coverage enables quick checks for spectral index, the slope that describes how a source brightens or fades with frequency. Curved slopes can hint at absorption or multiple components along a line of sight.
The survey is also friendly to pulsars, rapidly spinning neutron stars that often fade quickly with increasing frequency. Their typical spectral index clusters near minus 1.4, based on a population analysis that examined survey yields across bands.
Where to find and use the data
Images and catalogs are free to browse and download. The project’s official archive provides programmatic access plus links to image mosaics.
Teachers can fold this into labs that estimate spectral slopes for bright sources. Students can test whether blue tinted patches in radio color match up with known thermal regions in infrared maps.
Researchers can chase supernova candidates with steep radio slopes and faint optical counterparts. Others can sift the steepest spectrum objects for new pulsar targets that time domain searches missed.
Amateurs can simply explore. The color contrasts alone tell a tidy story about how hot gas, relativistic particles, and magnetic fields weave together in our corner of the Galaxy.
The study is published in Publications of the Astronomical Society of Australia.
—–
Like what you read? Subscribe to our newsletter for engaging articles, exclusive content, and the latest updates.
Check us out on EarthSnap, a free app brought to you by Eric Ralls and Earth.com.
—–


