The Noto earthquake raised the ground by up to 16 feet, as shown by a new 3D model
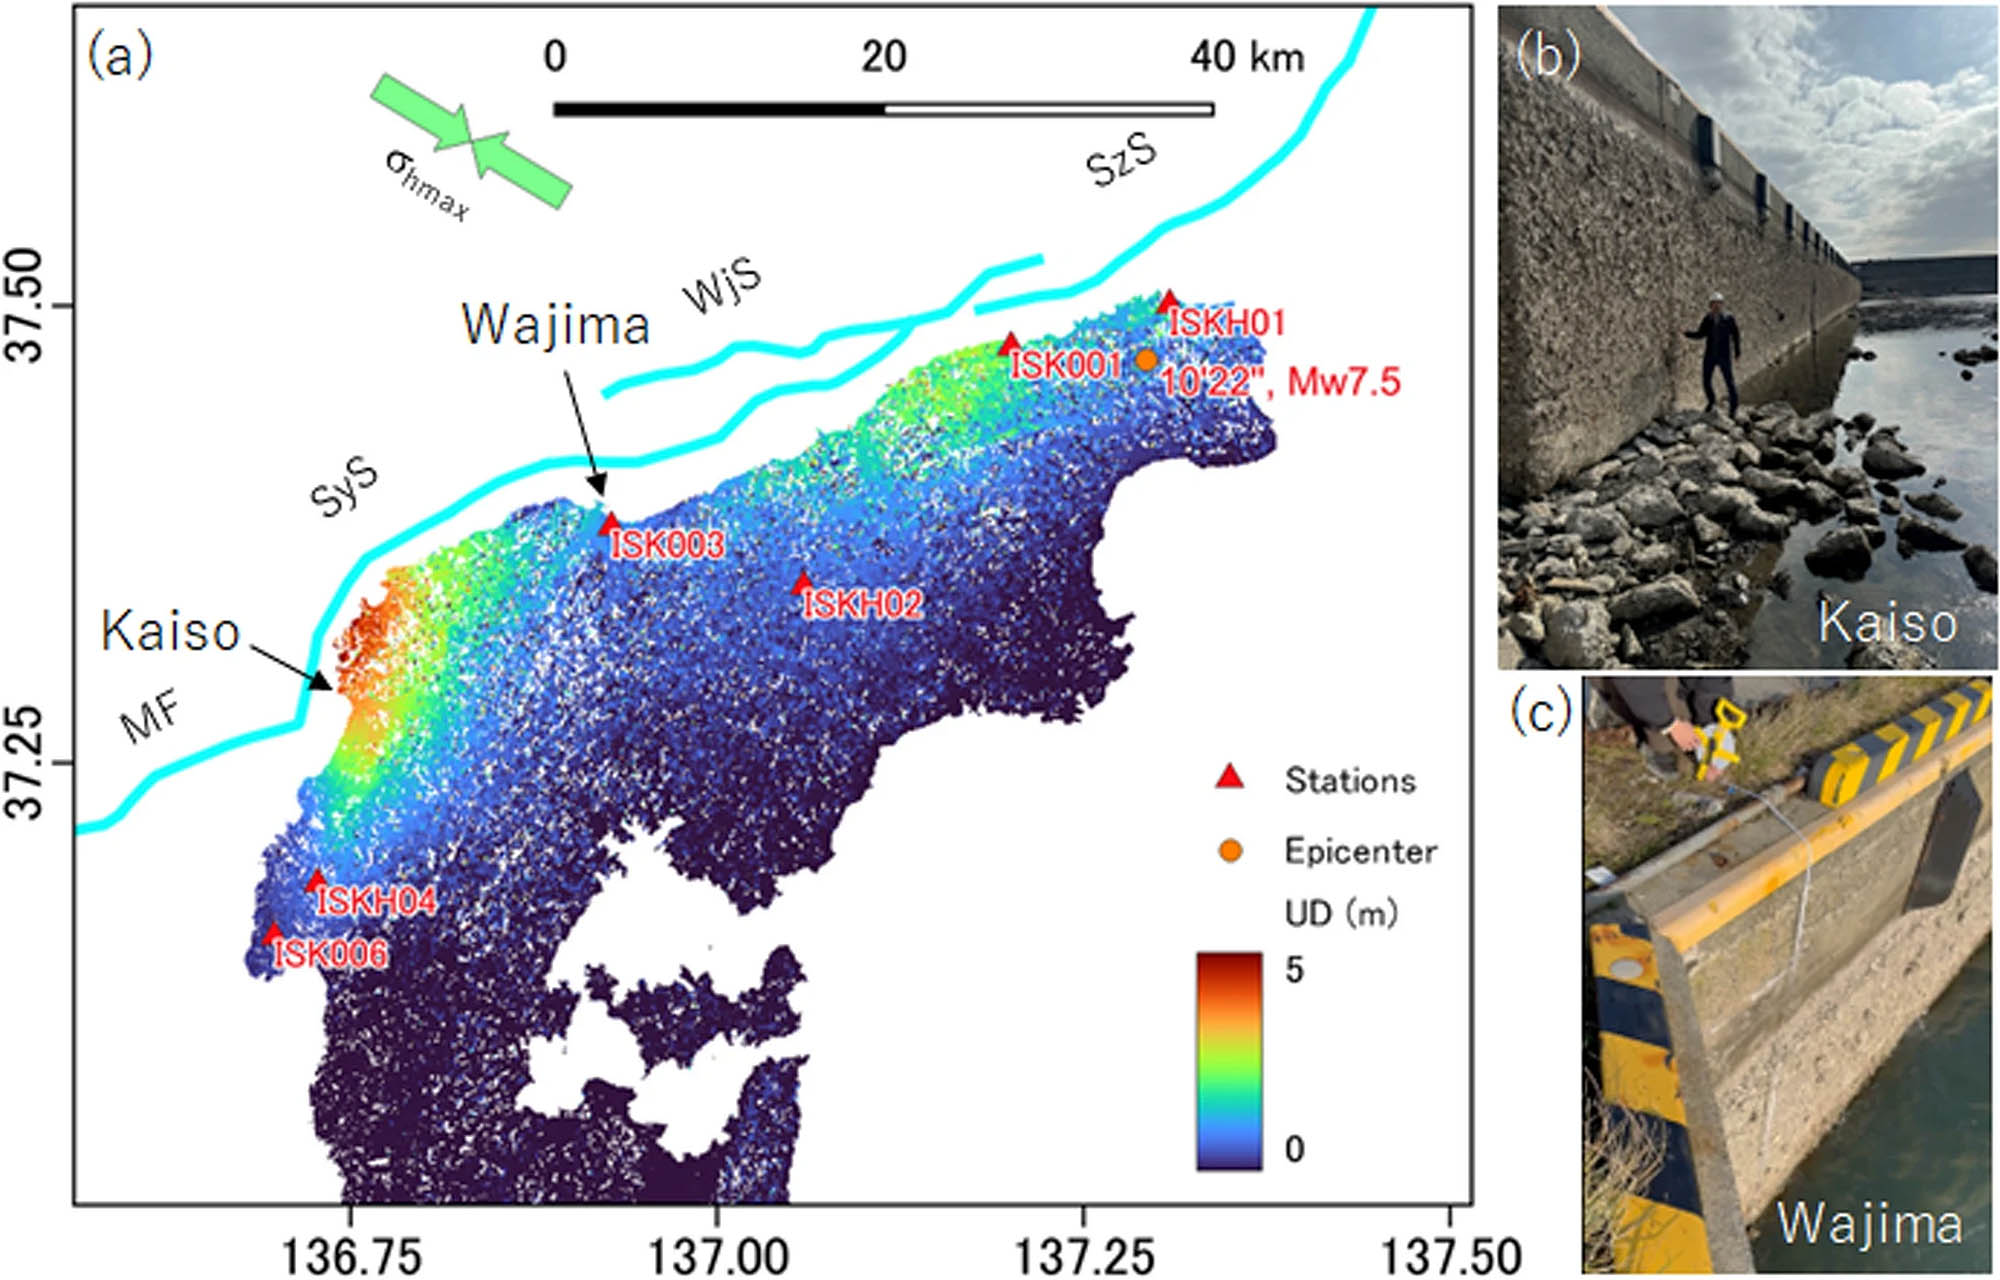
Five meters of uplift turned fishing piers into cliff tops on January 1, 2024, when a magnitude 7.5 earthquake rattled Japan’s Noto Peninsula.
That stark change in ground level puzzled locals and scientists alike, because the rise was anything but uniform, some villages shot up more than 16 feet, while others barely budged.

The new study comes from Associate Professor Ryosuke Ando and colleagues at the University of Tokyo, who built the first full 3‑D dynamic model of the hidden faults responsible for the disaster.
Reading the land’s sudden rise
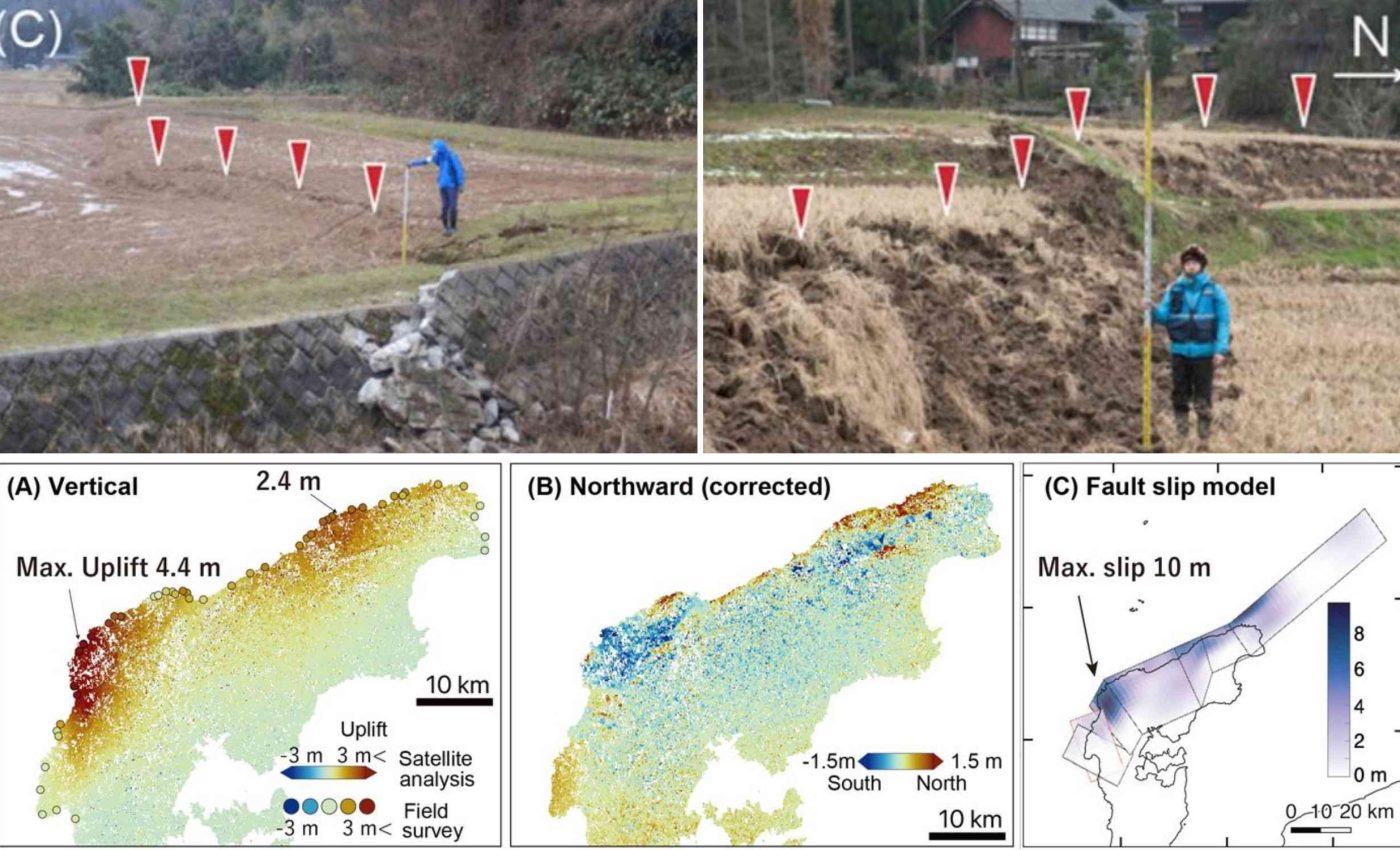
Field crews found freshly exposed tide pools perched well above the new waterline, confirming satellite estimates of extreme vertical motion in pockets along the peninsula.
Those measurements relied on synthetic aperture radar images that compared pre‑ and post‑quake terrain and pegged the maximum uplift at about 5 meters, or roughly 16.4 feet.
Fault maps showed three main strands: two southeast‑dipping slices of crust and a northwest‑dipping partner, together forming a set of conjugate faults that move in opposite directions.
The team fed those geometries, along with years of micro‑quake data, into a supercomputer, carving an irregular lattice that traced bends, branches, and dips miles below the Japan Sea.
Why bends and branches matter
Model runs revealed that uplift clustered where the fault geometry suddenly warped; kinks forced the slipping blocks upward, popping the surface like a stiff hinge.
That finding echoes earlier global work showing that crooked traces concentrate stress and shape the size of earthquakes.
The model also accounted for past earthquakes in the region, including a magnitude‑6.6 event in 2007 that had already released some stress on one of the major faults.
This prior rupture likely reduced the chance of a full reactivation in 2024, acting as a stress shadow and explaining why certain segments did not slip again despite being part of the same system.
Noto earthquake had warning signs
In the years leading up to the mainshock, the region experienced clusters of seismic swarms, which hinted at deeper pressure building up.
These smaller quakes weren’t strong enough to cause damage, but they pointed to fluids or fault weakening processes that eventually helped trigger the major rupture.
“During the Noto Peninsula earthquake, we saw devastating uplift in some areas compared to others. Our simulation with a supercomputer enabled the analysis of the three‑dimensional fault geometry,” said Ando, explaining how billions of calculations traced the rupture’s split‑second sprint.
The team ran multiple simulations with different input conditions, including changes to the fault’s dip angle, to see what scenarios matched the actual seismographic and satellite data.
One version, with a dip of 50 degrees on the offshore segment, most closely reproduced the ground deformation seen in radar images and matched the official moment rate curve from Japan’s Meteorological Agency.
Tuning future forecasts
By tweaking initial rupture locations and fault stress assumptions, researchers explored how slight changes might affect which areas see more slip or stronger shaking.
These sensitivity tests help explain why similar earthquakes can leave wildly different marks on the surface, even if they occur on the same fault system.
Because the model was built only from information available before the quake, its success hints that planners could run similar scenarios elsewhere and flag communities sitting above future pop‑up zones.
Challenging the old playbooks
Physics‑based forecasting was once the stuff of conference posters, but dynamic models have already untangled complex multi‑fault events such as New Zealand’s 2016 Kaikōura earthquake.
Traditional earthquake forecasting often relies on past shaking patterns, but those methods can miss the surprises hidden in underground curves and corners.
The Noto simulation showed that stress builds unevenly along fault bends, meaning the worst damage might land far from where the last big quake hit.
Why the Noto earthquake model matters
Japan is one of the most instrumented countries on Earth, but even there, predicting which faults will rupture next remains a gamble.
This study shows how supercomputer simulations might shift that from guesswork to something closer to science, especially when informed by real geometry and stress data.
The peninsula still groans under aftershocks, and geologists are checking for silent creep that might ease or reload the stressed sections left behind.
In the meantime, the fresh 3‑D view of Noto’s broken basement offers a template for emergency drills, coastal engineering, and even oyster farmers wondering where the shoreline will sit in a decade.
The study is published in Earth, Planets and Space.
—–
Like what you read? Subscribe to our newsletter for engaging articles, exclusive content, and the latest updates.
Check us out on EarthSnap, a free app brought to you by Eric Ralls and Earth.com.
—–


