New stress map reveals where Earth is on the verge of breaking apart
A new world map shows how Earth’s crust is loaded and where it is closest to failure. The release compiles 100,842 stress entries, more than double since 2016.
The project is run at the GFZ Helmholtz Centre for Geosciences with partners at The University of Queensland. The map guides choices in earthquake science and safer drilling across sectors.
Why stress maps matter

The work was led by Oliver Heidbach, a geophysicist, at the GFZ Helmholtz Centre for Geosciences. His research focuses on crustal stress and earthquake hazards.
Understanding tectonic stress, the push and pull forces inside the crust, helps explain why faults load and fail. It also reveals where small shifts can cascade into damaging earthquakes.
The same knowledge supports geothermal power, carbon storage, and deep waste isolation. Design choices depend on how tunnels and wells sit relative to the prevailing stress.
It also anchors geomechanical models that test what might change during operations. With better inputs, forecasts become clearer and safer decisions follow.
What the new stress map shows
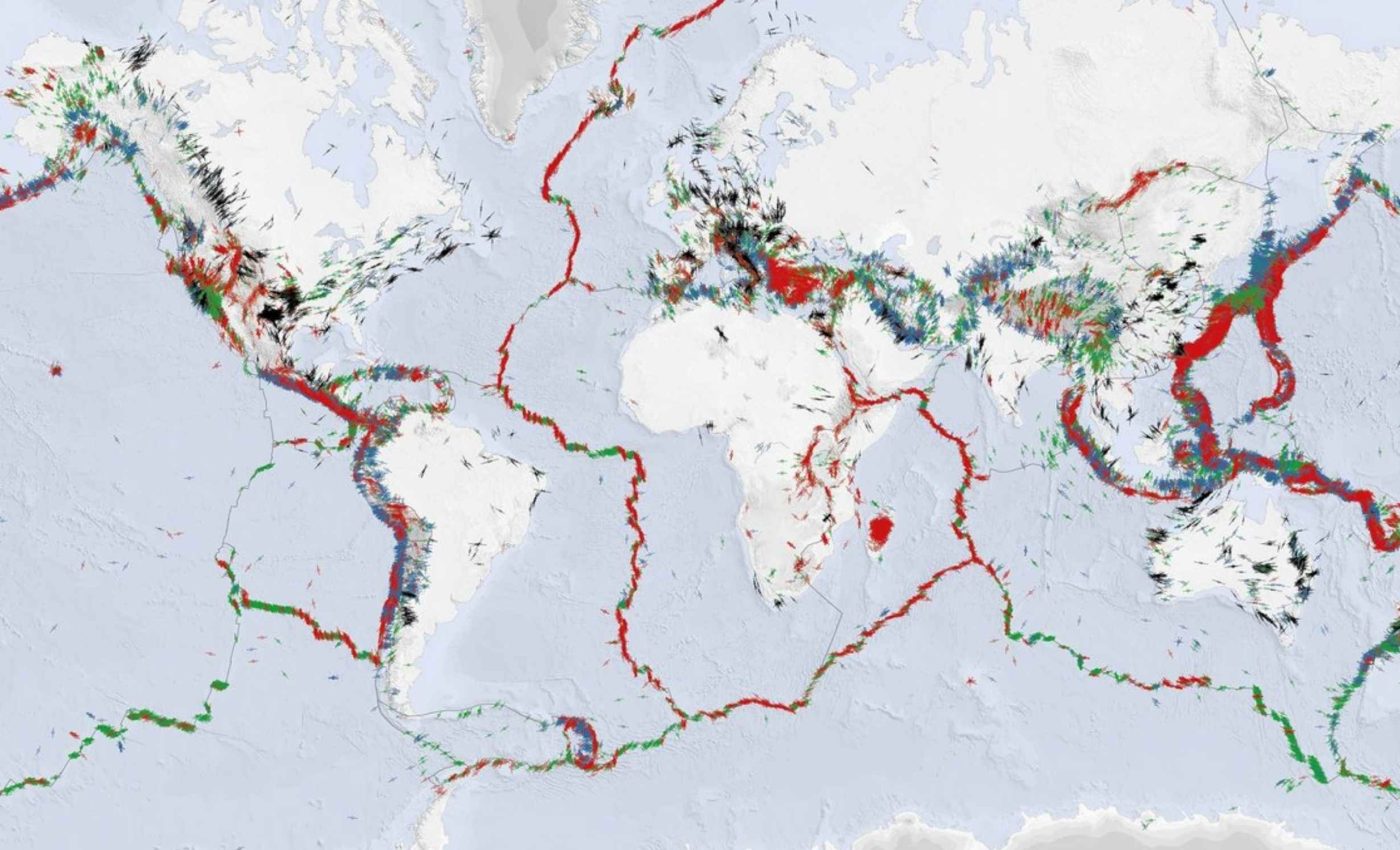
The database tracks the orientation of maximum horizontal stress, SHmax, the sideways direction that squeezes rocks most. It compiles measurements from boreholes, seismic events, and field tests into a consistent global picture.
On the global map, red marks normal faulting, green marks strike slip, and blue marks thrust. The colors show which principal stress dominates in a given place.
The team also added almost 3,000 deep boreholes and adopted a unified earthquake focal mechanism catalog. Those steps refine the signal in places that once looked blank.
A revised quality scheme flags the strongest measurements and tracks uncertain ones. A new X class marks rare or incomplete indicators so users can filter wisely.
The Bowen Basin surprise
In eastern Australia, a dense network of mine boreholes reveals a sharp rotation of SHmax by over 50 degrees within about 62 miles. That pattern comes from a high resolution paper.
Prof. Heidbach said the data support the long-held idea that lateral variations in rock properties and density contrasts can cause noticeable shifts in stress orientation over short distances, turning a long-standing hypothesis into a measurable test.
Local geology can redirect far field forces in complex basins. That helps explain why continent scale motion does not always match local stress.
The practical takeaway is straightforward. Safer drilling paths can point in different directions just a few miles apart.
Safer drilling and storage
Researchers noted that earthquakes are not always purely natural events and that human activities such as drilling or fluid injection can sometimes trigger them, a warning supported by decades of field evidence in active basins.
The USGS explains how fluid injection can raise pore pressure and trigger faults. Risk management starts with mapping the stress field before any well is drilled.
At repository depth, gallery orientation affects long term stability. Corridors aligned perpendicular to SHmax tend to resist spalling better than ones cut parallel to it.
Operators also use stress data to choose casing designs and mud weights. Those choices reduce breakout, stuck pipe, and costly sidetracks.
How scientists read the rocks
Analysts look for borehole breakout, elongated chips where the borehole wall fails, to read stress direction. These features form when rock strength is exceeded around the hole.
Engineers pair image logs with caliper data to capture breakouts and drilling induced fractures. From those patterns they recover SHmax and the local stress regime.
Seismologists invert earthquake source data to fill gaps at depth. Together, the methods paint a coherent and testable view of stress.
Open data you can use
The map and its data are free to explore for research and industry. Anyone can build a custom stress map with CASMO in just a few clicks.
A layered global file lets users toggle indicators, regimes, and quality levels. That flexibility makes it easier to see how conclusions depend on the inputs.
Behind the scenes, a new database platform speeds future updates and opens the door to annual releases. It also integrates a global catalog of earthquake source mechanisms so coverage is more uniform.
From data to decisions
Stress maps plug into reservoir and hazard models that estimate rock failure. With sharper inputs, planners can target well paths, pad orientation, and injection schedules.
Clearer stress patterns also improve hazard scenarios for urban areas and dams. Emergency planners can test how a sequence might evolve if small faults let go.
The update marks a move toward routine refreshes rather than rare big releases. That rhythm means local data can flow into the map while projects are still active.
A shared format now captures metadata that used to sit in separate files. That change trims the time from data gathering to practical use.
Lessons from the new stress map
Expect more records as borehole imaging spreads to new basins. As data density improves, regional anomalies will be easier to test against geology.
Crowdsourced submissions from industry and agencies can speed that progress. A shared standard keeps the science reproducible while protecting site specifics.
New stress magnitude and pore pressure datasets are already in development. Together with SHmax, they will round out the picture of how rocks fail.
Photo credit: The World Stress Map Project.
—–
Like what you read? Subscribe to our newsletter for engaging articles, exclusive content, and the latest updates.
Check us out on EarthSnap, a free app brought to you by Eric Ralls and Earth.com.
—–


