Earth is at a crossroads: Wealth soars, yet poverty deepens and ecosystems are crumbling
A new study tracking how the world has changed from 2000 to 2022 has reached a stark conclusion. Earth’s support systems are facing environmental and social strains of unprecedented magnitude.
The global economy more than doubled, yet billions still lack food, housing, and healthcare. The authors of the study also found that progress on human deprivation is far too slow to meet the 2030 goals.

Scientists warn that six of nine boundaries are already beyond safe limits, which means the dashboard’s environmental signals are flashing red.
Earth’s environmental strain
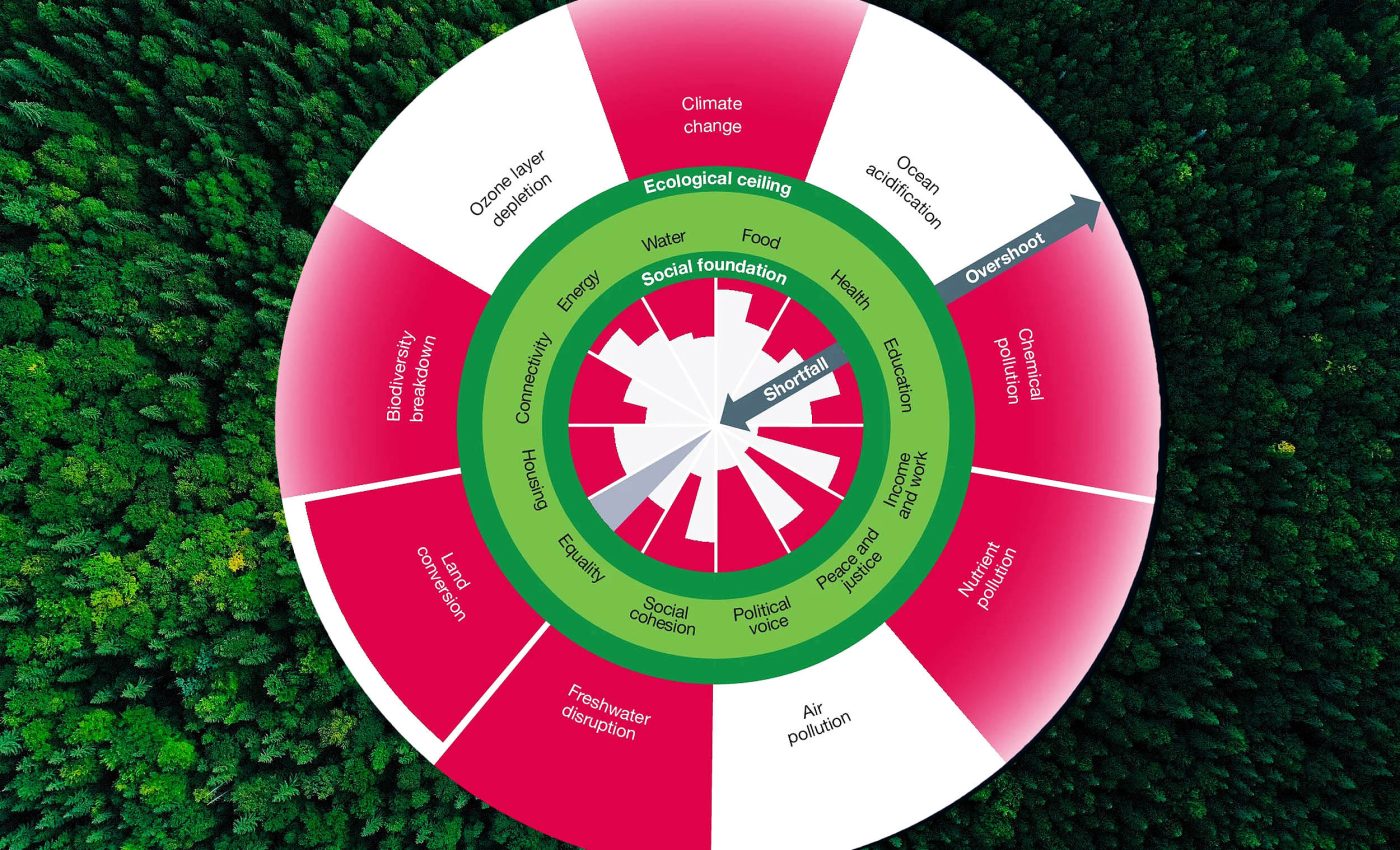
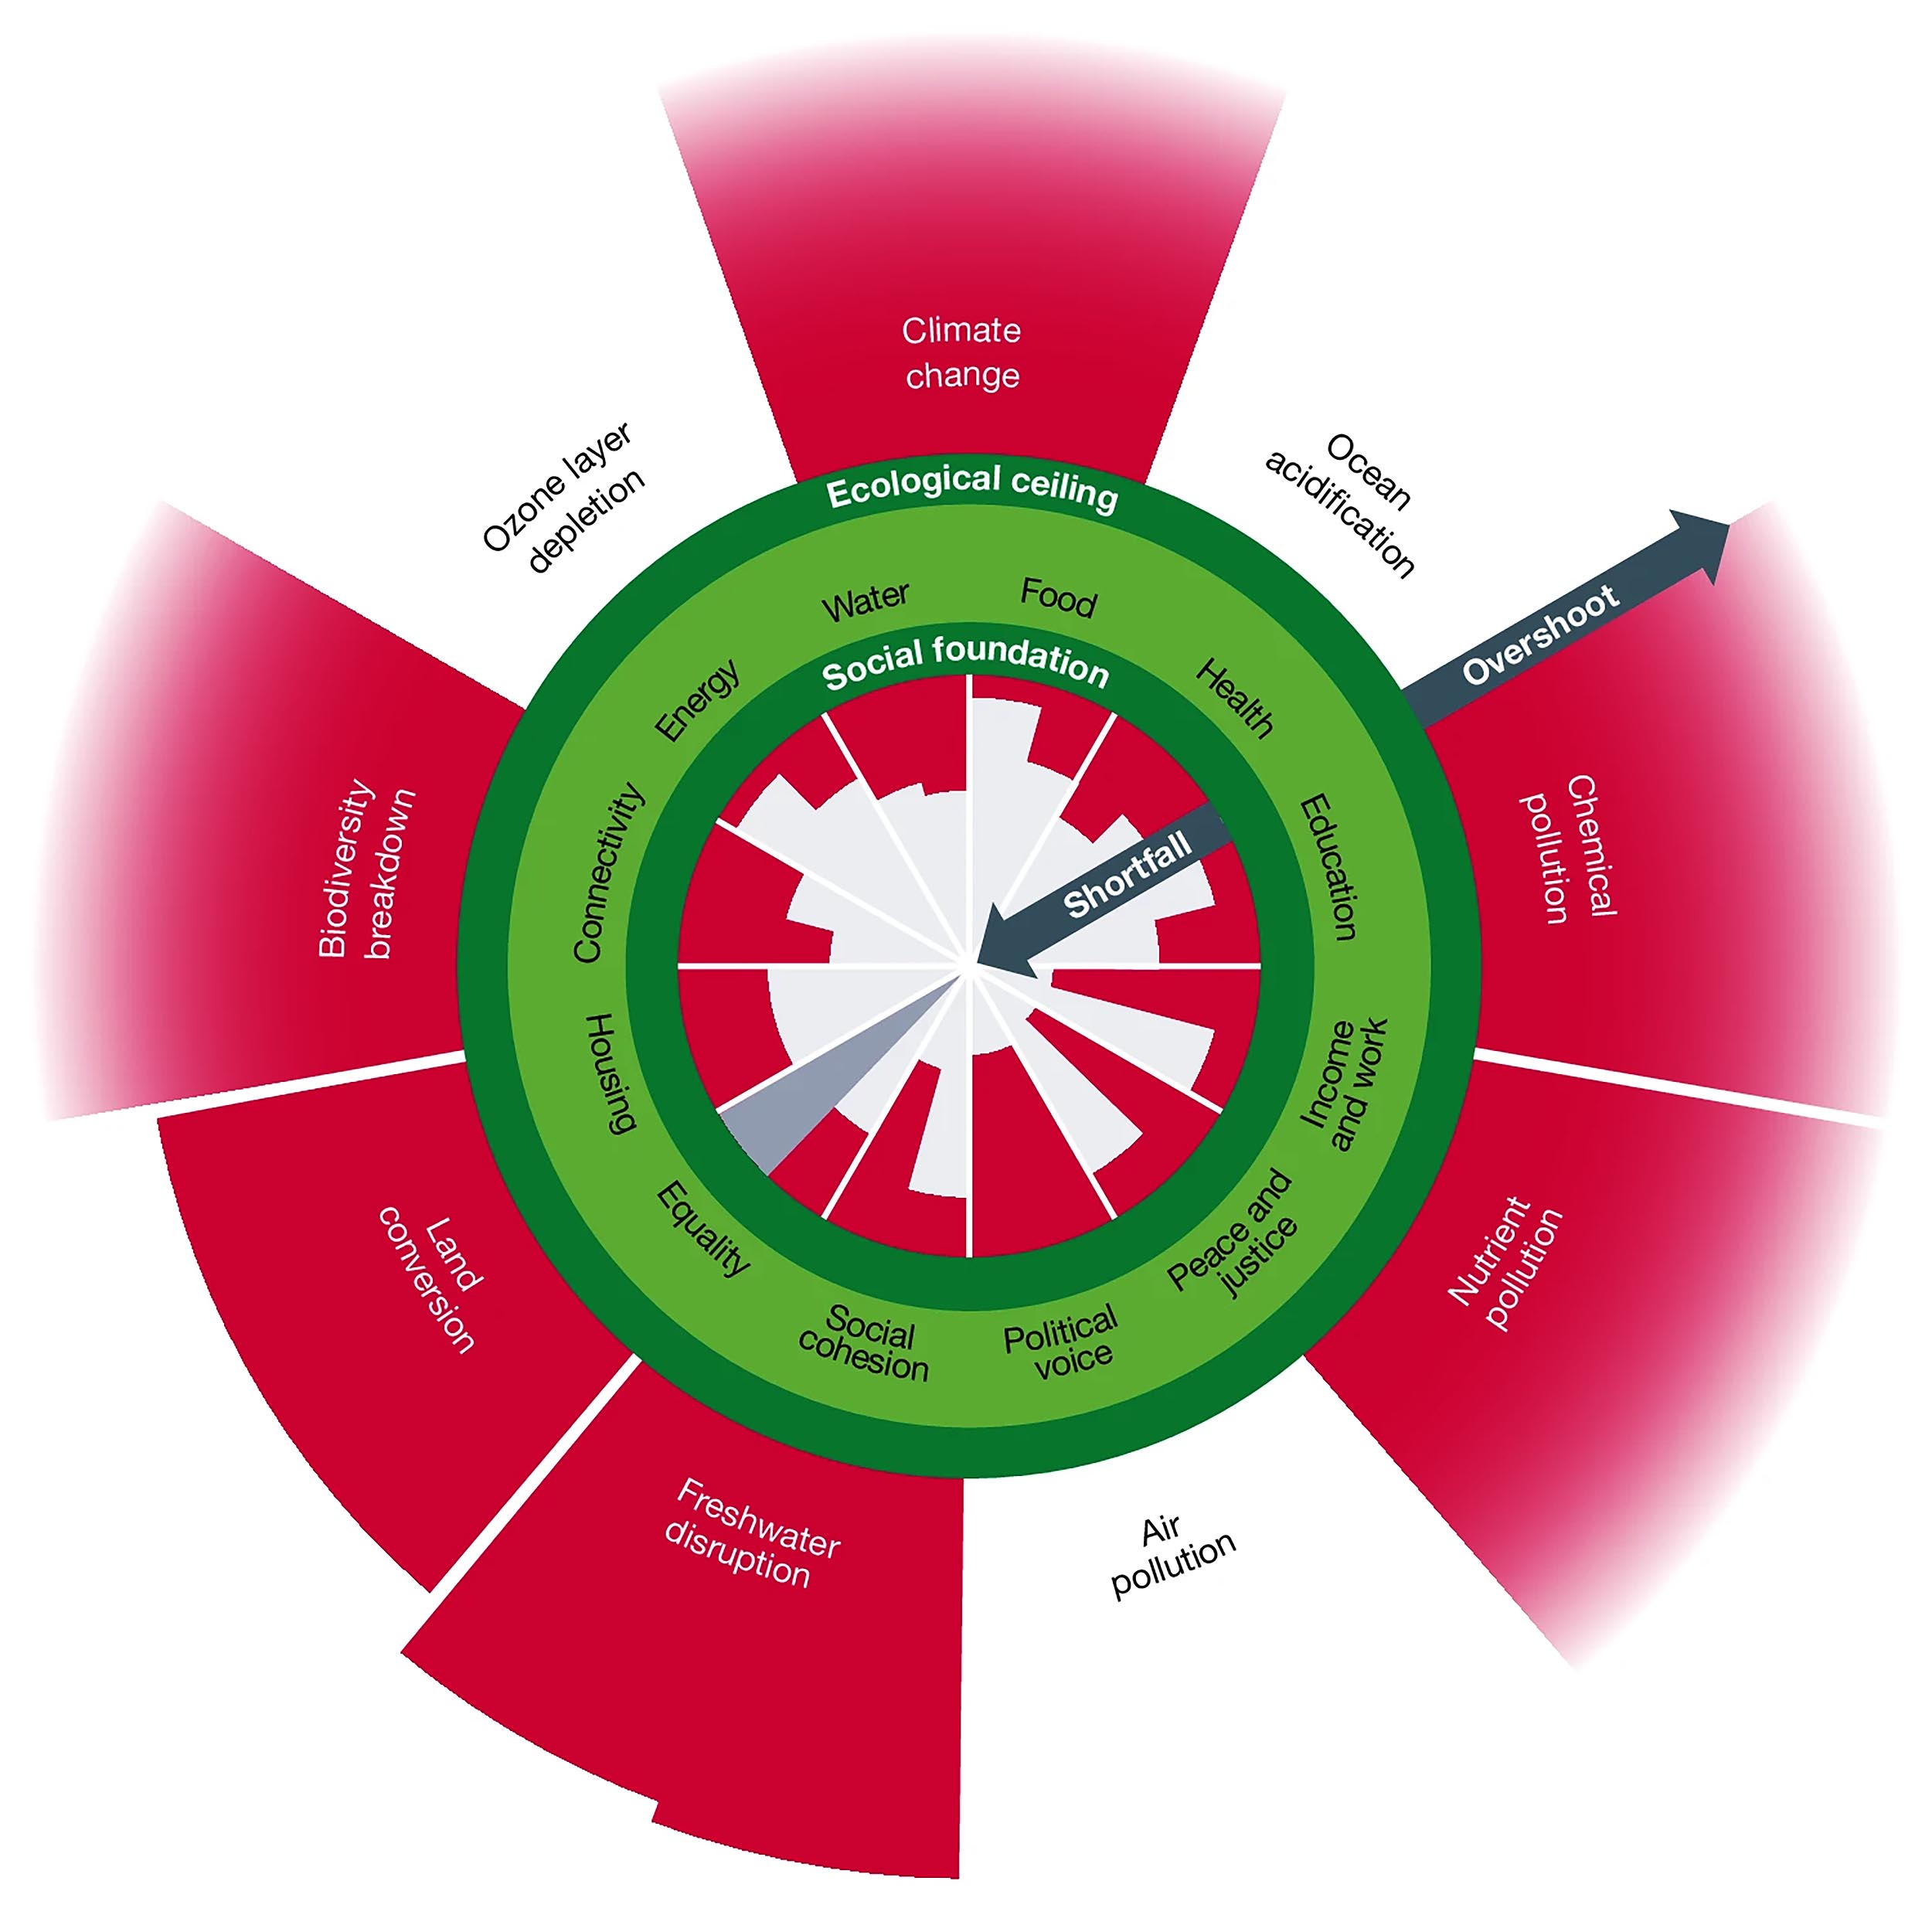
The Doughnut framework sets two rings: a social foundation below which people fall short on life’s essentials and an ecological ceiling above which human activity destabilizes Earth. The safe space sits between them.
The authors distilled 35 indicators to track social shortfall and ecological overshoot over two decades.
They combined time series on access to basics like clean water with measures that reflect pressure on climate, nutrients, freshwater, and biodiversity.
Andrew Fanning of Doughnut Economics Action Lab and the University of Leeds is the lead author.
An earlier cross-country paper found that no nation met basic needs at a level of resource use that could be shared globally.
The new global dashboard updates that picture annually and shows where change is actually happening.
The study’s lens is wide but precise. It ties social gaps to minimum standards and environmental pressure to downscaled planetary limits, so the results are comparable across themes without getting lost in jargon.
From 2000 to 2022: What changed?
There were notable gains. Internet connectivity, health service coverage, child survival, safe sanitation, and clean indoor fuels improved for large shares of the world.
Other basics barely moved or went backward. Food insecurity rose, and political voice weakened, even as undernourishment, unsafe drinking water, lack of social support, youth unemployment, and perceptions of corruption showed little improvement.
The median share of the global population in social shortfall fell from 47 percent to 35 percent by 2022. That is still about 3 billion people below the floor of essential living standards.
On the ecological side, the trend went the other way. Overshoot grew across most indicators, with nitrogen, phosphorus, hazardous chemicals, green water disruption, radiative forcing, and atmospheric CO2 pushing farther beyond safe limits.
Who is to blame?
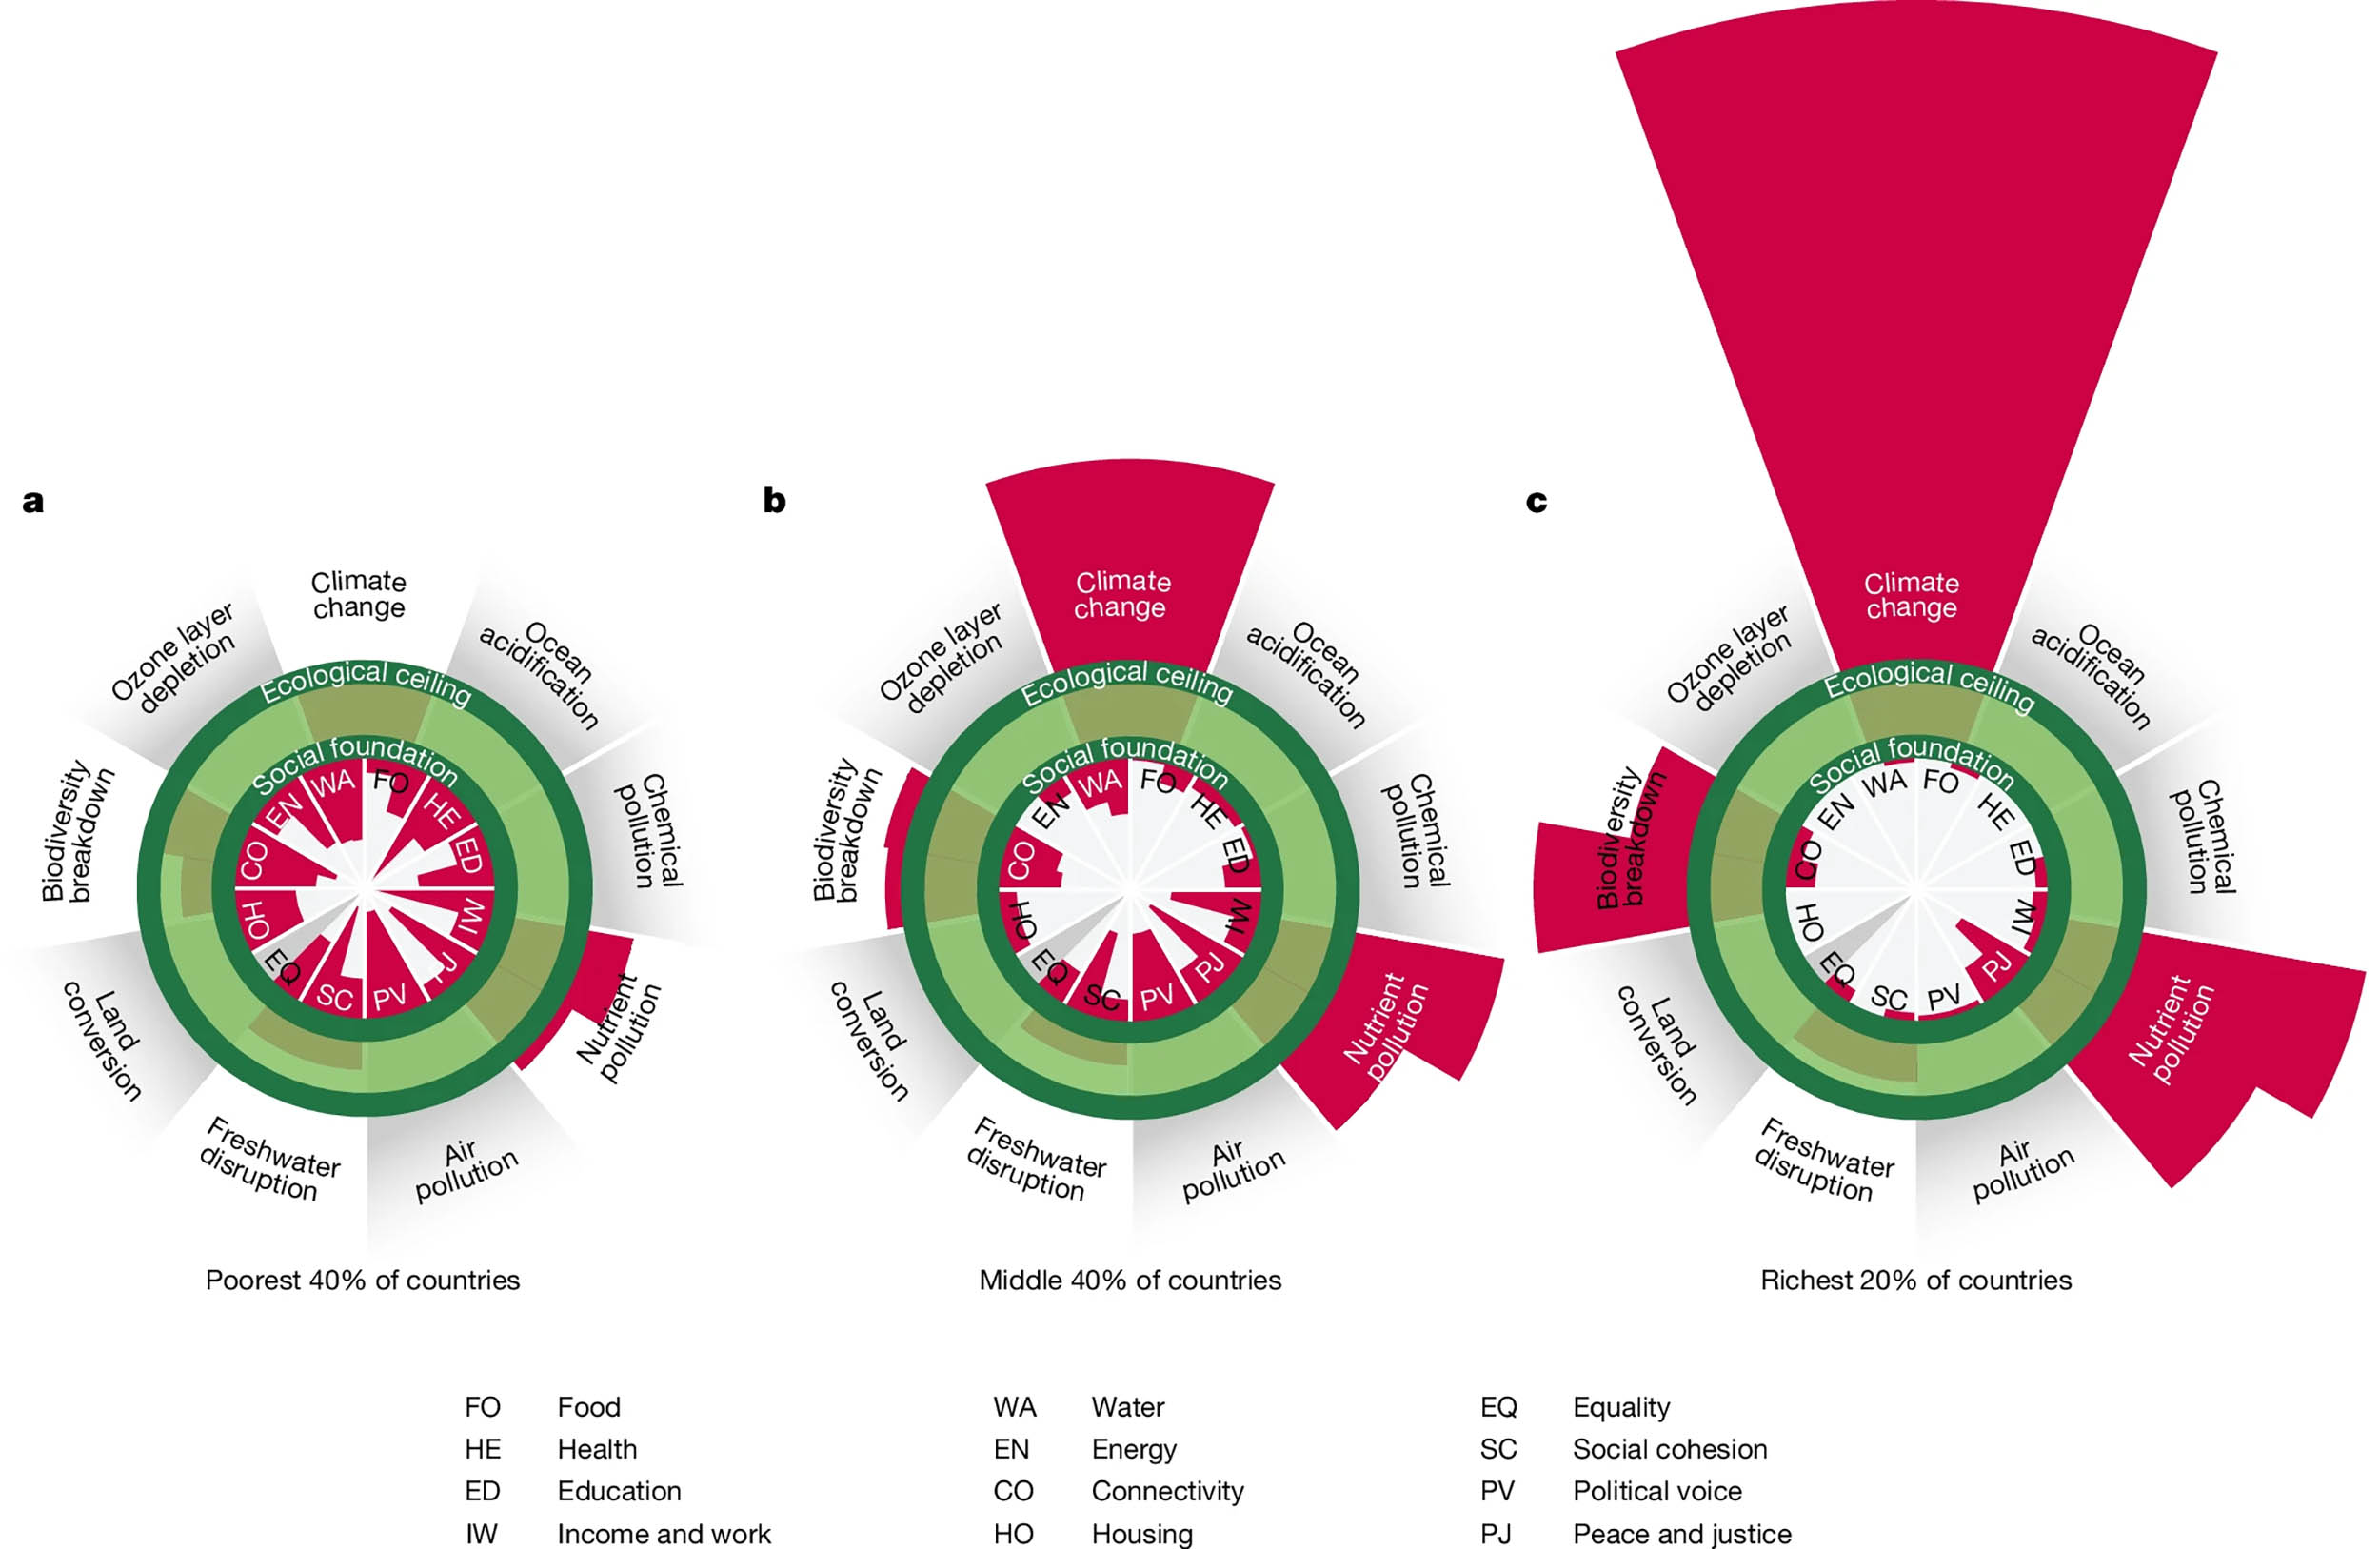
The world’s richest 20 percent of countries, home to about 15 percent of people, contribute more than 40 percent of annual ecological overshoot.
The poorest 40 percent, home to 42 percent of people, hold more than 60 percent of the global social shortfall.
This split matters. It shows that the people who face the biggest social gaps are not the ones driving most of the ecological pressure on the planet.
It also clarifies the task ahead. Social progress must accelerate in places with shortfalls, while consumption and pollution must fall fastest where overshoot is concentrated.
The numbers point to different priorities across country groups. That is how a “safe and just” trajectory becomes real rather than rhetorical.
Earth’s social strain
At current speeds, the world will not eliminate critical social shortfalls by 2030. The authors estimate progress must move about five times faster to meet that goal.
The enormous environmental strain caused by Earth’s global ecological damage must not only stop growing but reverse at nearly twice the current pace to safeguard a stable planet by mid-century.
That is a tall order, yet it sets a clear benchmark for policy and investment.
This is not a call for uniform action everywhere. It is a call for targeted pace, grounded in who bears deprivation and who drives overshoot.
It also highlights the limits of incremental fixes. Structural shifts in energy, food, materials, and governance will be needed to hit those rates.
Constant GDP growth unsustainable
A larger economy does not automatically deliver what people actually need. The data shows growth outran poverty reduction and widened the gap with planetary safety.
The global trend shows that an obsession with constant GDP growth, particularly in wealthy countries, is pushing humanity further away from a thriving and sustainable future rather than closer to it.
That view aligns with the indicators. Gains in digital access and health coverage do not translate into universal basics, and ecological overshoot continues to climb despite efficiency improvements.
A dashboard with social and ecological metrics offers a truer picture of progress. It keeps attention on outcomes that matter for people and the systems that support life.
Easing Earth’s ecological strain
Focus on meeting minimum social standards without blowing past ecological limits. That means scaling affordable clean energy, resilient water and sanitation, public health, and education, where gaps persist.
At the same time, reduce high consumption footprints where they are largest. Shift diets, recycle nutrients, restore forests, and cut fossil fuel use to bring multiple boundaries back toward safety.
The authors quantify the speed of change required, not to predict failure but to clarify ambition. Clear targets and annual tracking help turn ambition into accountability.
“Our analysis shows that despite rapid global economic growth, humanity is still leaving billions of people in deprivation while pushing Earth beyond its safe limits,” said Fanning.
An annual update will show whether social shortfalls are shrinking fast enough and whether overshoot is easing. That makes the dashboard a report card for a world that says it wants to be both safe and just.
It also invites better policy design. By linking progress to concrete indicators, leaders can see when a fix for one problem worsens another and adjust before damage spreads.
The study is published in Nature.
—–
Like what you read? Subscribe to our newsletter for engaging articles, exclusive content, and the latest updates.
Check us out on EarthSnap, a free app brought to you by Eric Ralls and Earth.com.
—–


