Beautiful mosaic of the Arctic

International science officials met in Washington, D.C. on September 18, 2016 for the first White House Arctic Science Ministerial. The purpose was to “expand joint collaborations focused on Arctic science, research, observations, monitoring, and data-sharing.”
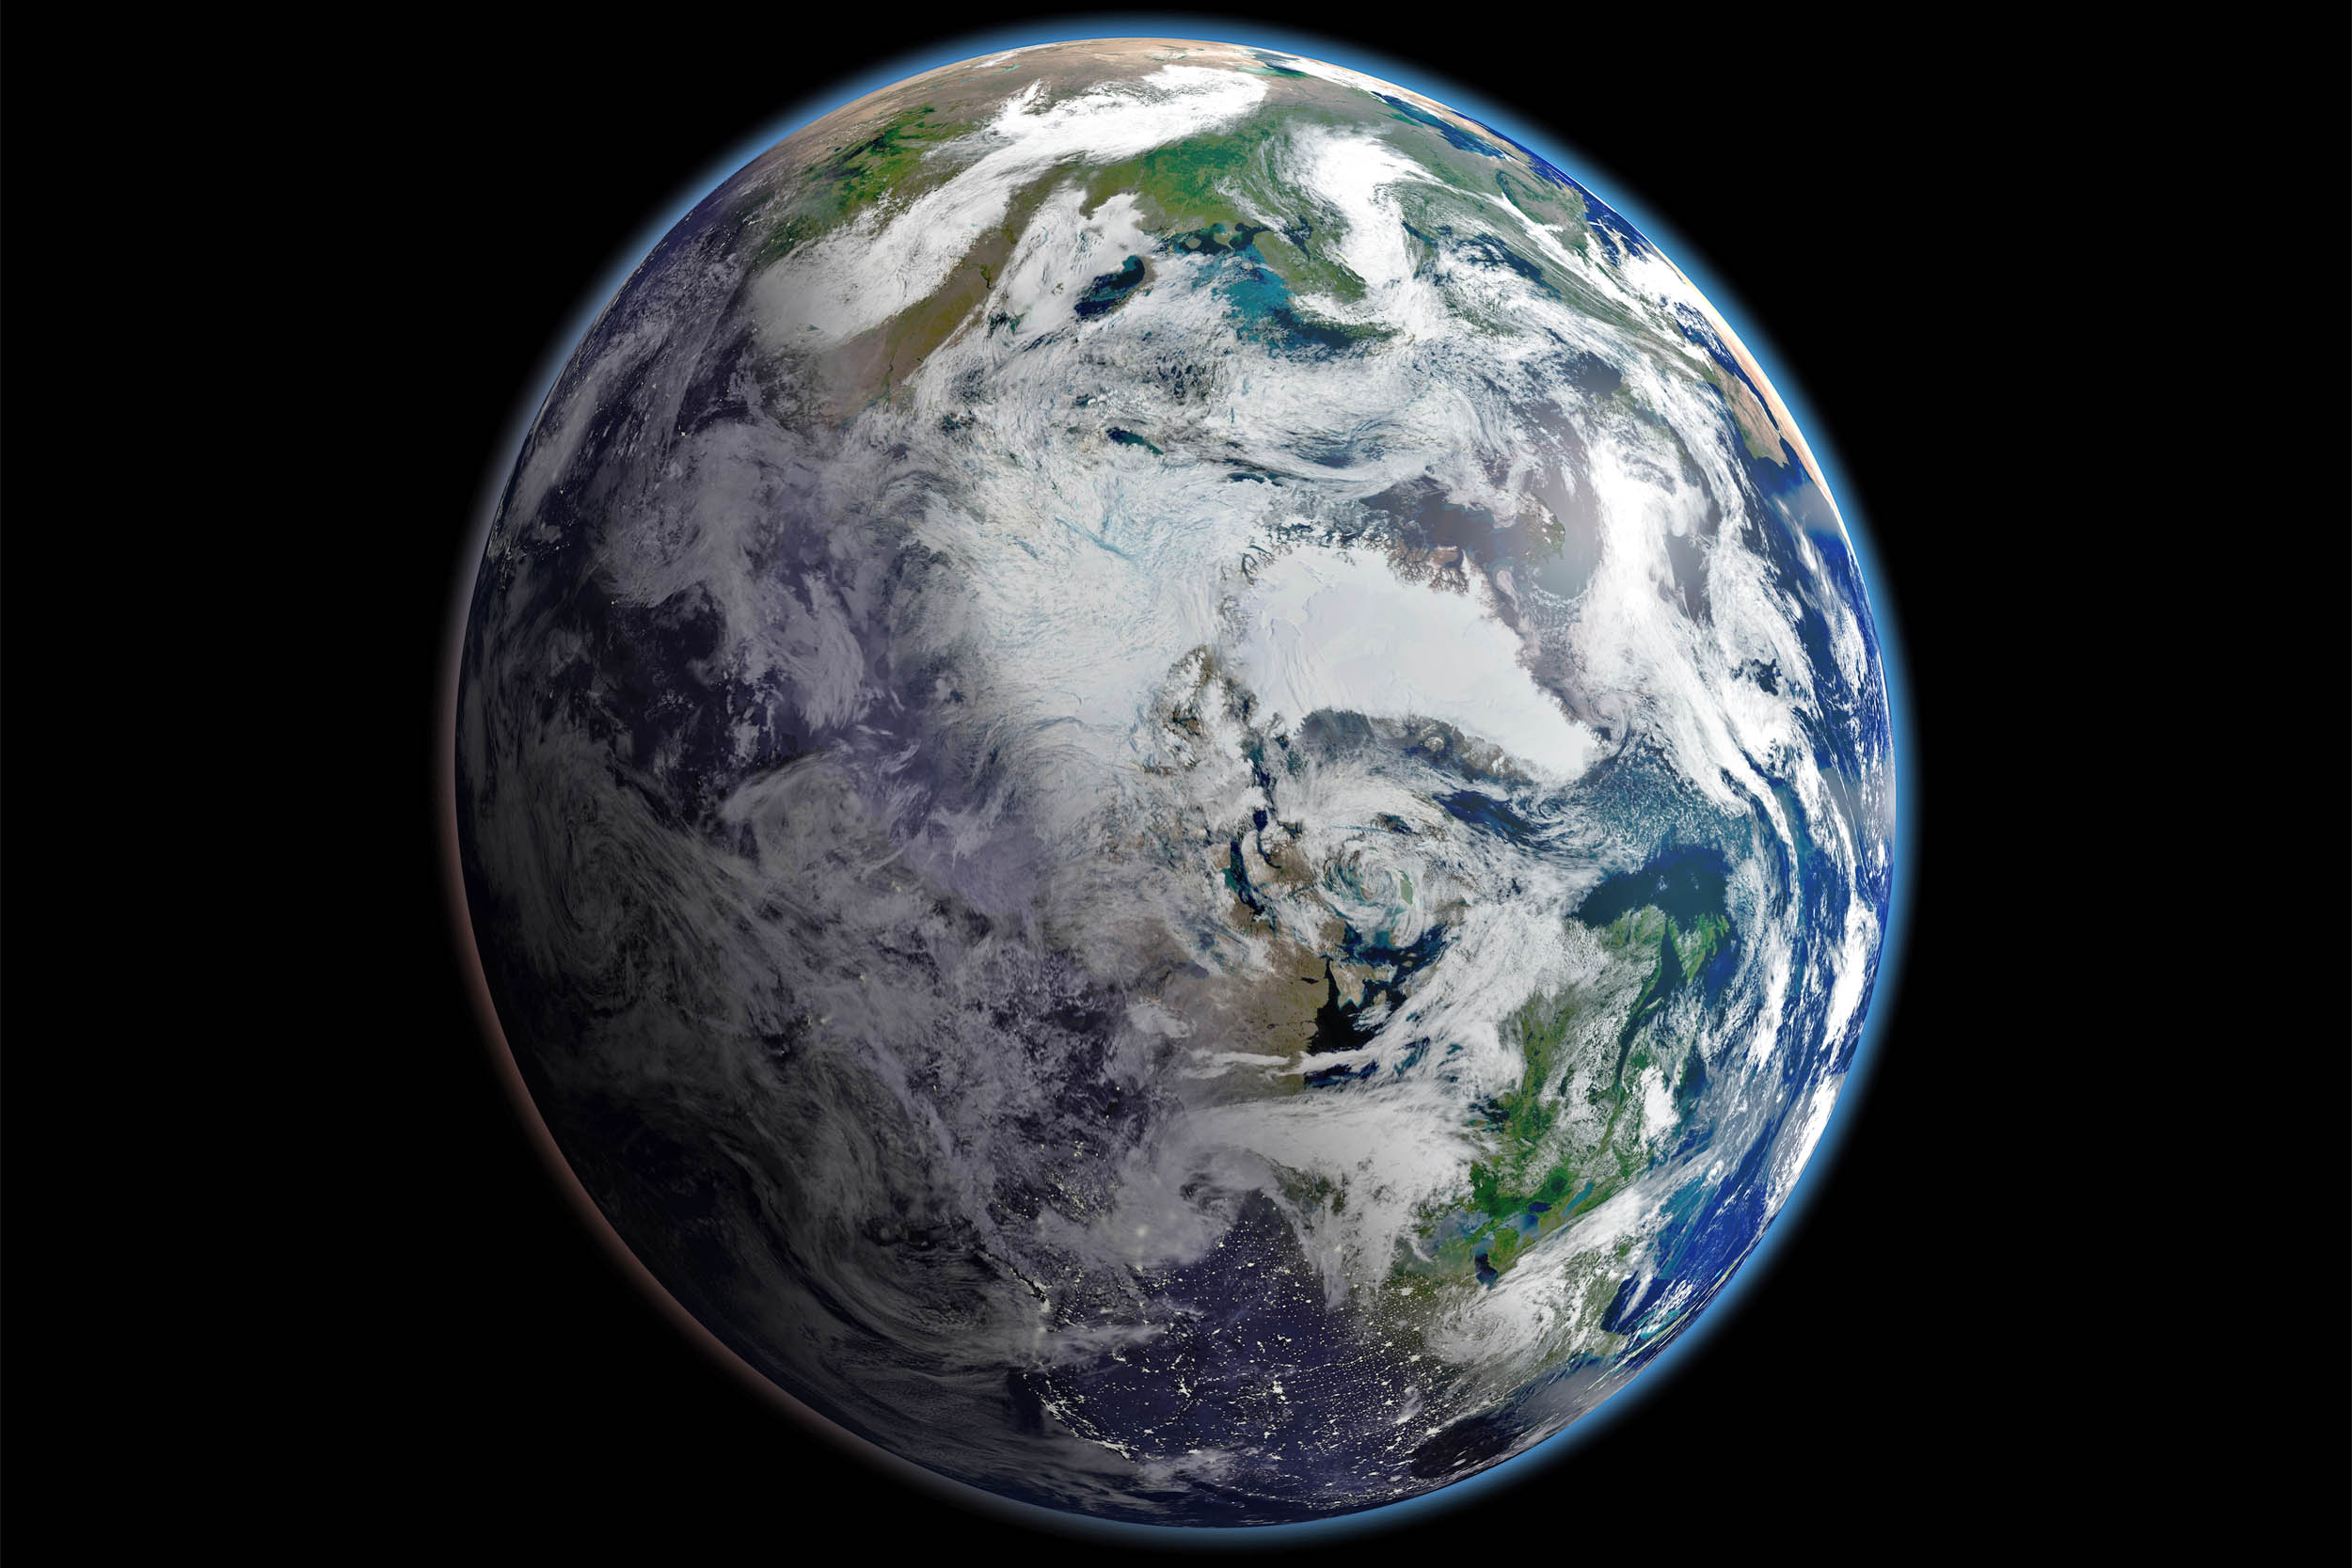
 To commemorate the event, NASA Earth Observatory composed this mosaic—a satellite-based view of the Arctic. The images were captured on September 2, 2012, by the Visible Infrared Imaging Radiometer Suite (VIIRS) on the Suomi NPP satellite. The composite was compiled from 14 orbits of the satellite and multiple imaging channels, then stitched together to blend the edges of each satellite pass.
Scientists collect data and make observations of Earth’s polar areas from the ground and from aircraft during field campaigns. But this vantage point of space offers a consistent, wide view. Satellites have enabled scientists to monitor the decline of Arctic sea ice since 1979.
Arctic sea ice generally reaches its maximum extent each March and its minimum extent each September. This ice has historically ranged from roughly 14-16 million square kilometers (about 5.4-6.2 million square miles) in late winter to roughly 7 million square kilometers (about 2.7 million square miles) each September. In recent years, however, those numbers have dropped.
The record lowest minimum ever observed was on September 16, 2012, when sea ice plummeted to 3.41 million square kilometers (1.32 million square miles). This image shows the area two weeks earlier.
 Records based on shipping records and ice charts begin as far back as 1953. The top plot above shows sea ice anomalies—how much Arctic sea ice cover was above or below the norm—since that year. The second plot shows the daily sea ice extent, determined from the near-continuous satellite record since 1979. It shows how progress toward the annual minimum in 2016 (the second lowest in the satellite record) measured up to 2012, as well as the historical average (blue dashed line).
Since the mid-2000s, low minimum extents in the Arctic have become the “new normal.”
—
Credit: NASA


News coming your way