
Satellites capture the largest ocean storm waves ever seen from space
When a big storm blows through, most people focus on the wind, the rain, and the damage it might leave behind. But out in the middle of the ocean, something else happens – something just as powerful and far-reaching.
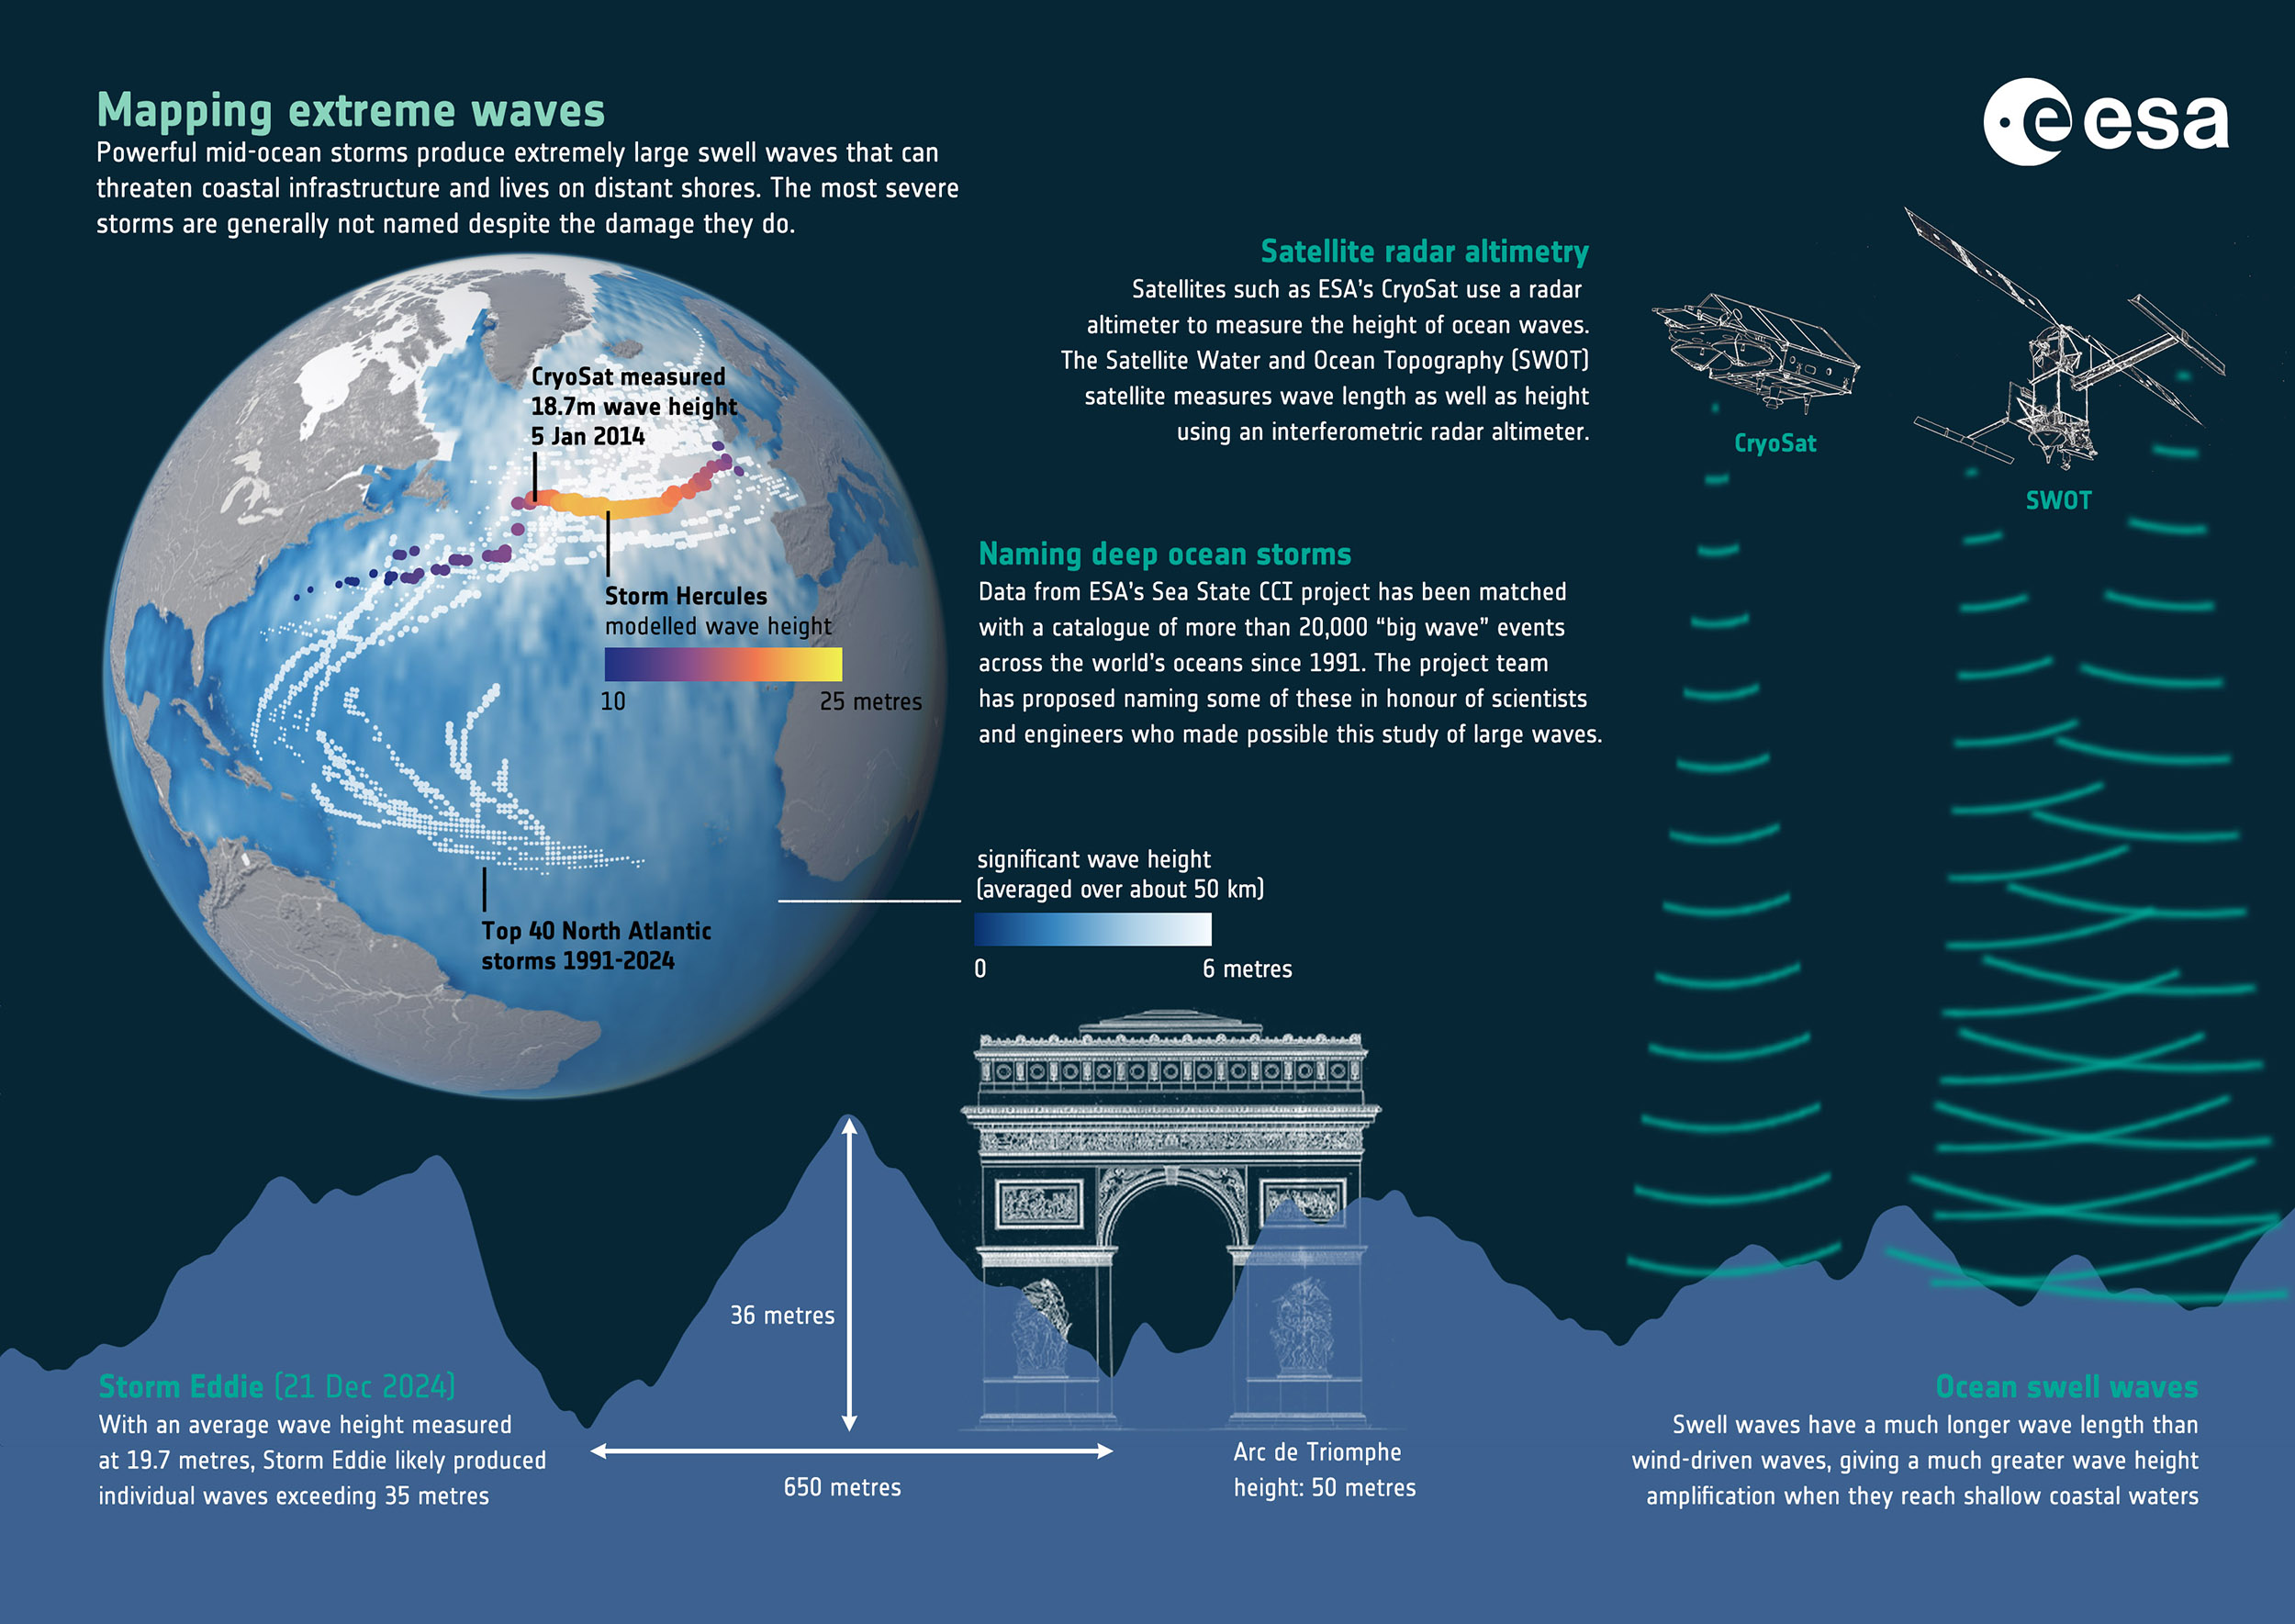
During a storm last December, satellites spotted ocean waves reaching almost 66 feet high. That’s about the height of the Arc de Triomphe in Paris. It’s also the highest average wave height ever measured from space.

But the size of the waves wasn’t the only surprise – these waves told a much bigger story.
What ocean swells really tell us
Ocean swells are waves that break free from the storms that formed them. They’re not the quick, choppy waves that slap the shore.
These waves are smoother, longer, and they roll across the ocean for days – sometimes weeks – without losing much steam. They can show up on distant coastlines even when the storm itself never gets close.
Wind kicks them off, but once they’re moving, they don’t rely on it to keep going. What matters is the timing between wave crests – called the wave period.
A longer period usually means a more powerful wave. If waves are rolling in every 20 seconds, it means a big, distant storm sent that energy a long way.
A recent study found that these swells act like messengers. They carry information about the storm’s size and strength, even if it happened thousands of miles away.
The path of giant waves
To dig deeper into how storm waves work, a research team used data from a mix of satellites. The most recent data came from SWOT – a new French-US satellite that scans the ocean in detail.
The experts combined this with data from older satellites, some going back more than 30 years, including Sentinel-3, Sentinel-6 Michael Freilich, Jason-3, CryoSat, SARAL, and CFOSAT.
The scientists tracked what happened during Storm Eddie on December 21, 2024. At its peak, this storm created waves nearly 66 feet tall in the open ocean – the largest average wave height seen in over a decade.
But what really stood out was what happened after the storm. The swell from Storm Eddie kept moving for more than 15 days, covering around 15,000 miles.
The swell started in the North Pacific, passed through the Drake Passage near Antarctica, and reached all the way to the tropical Atlantic by January 6, 2025.
Where wave energy hides
The data helped scientists do something new. They didn’t just measure wave height – they also looked at how wave energy was spread out.
Until now, it was widely believed that the longest ocean waves carried most of the energy as they spread across oceans. But the new measurements told a different story.
It turns out, more energy is packed into the storm’s dominant peak waves, not the longest swells. This is a big shift from what earlier models assumed. That matters because wave energy affects how coastlines erode, how marine structures hold up, and how we predict damage during big storms.
“Climate change may be a driver, but it is not the only one,” said Fabrice Ardhuin, who led the study in the Laboratory of Physical and Spatial Oceanography in France.
“At the coast, seabed conditions also shape waves, for example, and these very large storms are rare – occurring roughly once a decade – which makes it hard to prove trends.”
The scientists now want to connect these results to climate change, to see how storm patterns are shifting over time. Thanks to long-term satellite records, they can start to track storm intensity with more confidence.
Watching storms from space
The highest wave recorded over the past 34 years didn’t come from Storm Eddie. That record belongs to Atlantic Storm Hercules in January 2014, which hit 75 feet and damaged coastlines from Morocco to Ireland.
Still, Eddie’s waves helped the team validate satellite models in extreme conditions. That means better tools to predict ocean behavior in the future.
One mission that played a big role was Copernicus Sentinel-6. Though it was designed mainly to monitor sea-level rise, it also tracks wave height and wind speed in real-time. This helps with day-to-day ocean forecasting, especially for shipping, fishing, and coastal safety.
SWOT also brought something new to the table. It combines traditional radar with wide-swath imaging, which means it can catch smaller swells (as low as 1.2 inches) and waves that stretch over three-quarters of a mile in length – waves other satellites often miss.
Now, with clearer pictures of how wave energy works, the models can show what’s really going on out there. That could lead to better warnings, stronger coastal defenses, and smarter planning as climate patterns continue to shift.
Storms without landfall
Big storms don’t need to hit the shore to make an impact. Their waves can travel thousands of miles and still cause real damage. Understanding these swells and where their energy goes isn’t just about science – it’s about safety.
By combining decades of data with new satellite technology, scientists can finally track storms not just by where they hit, but by the waves they leave behind.
Information for this article was obtained from a report released by the European Space Agency.
—–
Like what you read? Subscribe to our newsletter for engaging articles, exclusive content, and the latest updates.
Check us out on EarthSnap, a free app brought to you by Eric Ralls and Earth.com.
—–


