U.S. air conditioning map shows great divide between who stays cool and who doesn’t
Summer heat keeps breaking records. Cities feel hotter, rural areas struggle more, and air conditioning has turned into a lifeline. But who in the United States actually has reliable cooling? And who suffers without it?
Those are the questions that guided Yoonjung Ahn, an assistant professor at the University of Kansas. Her new research, published in Scientific Data, delivers the clearest national picture yet of how cooling access varies from home to home.
Air conditioning gap

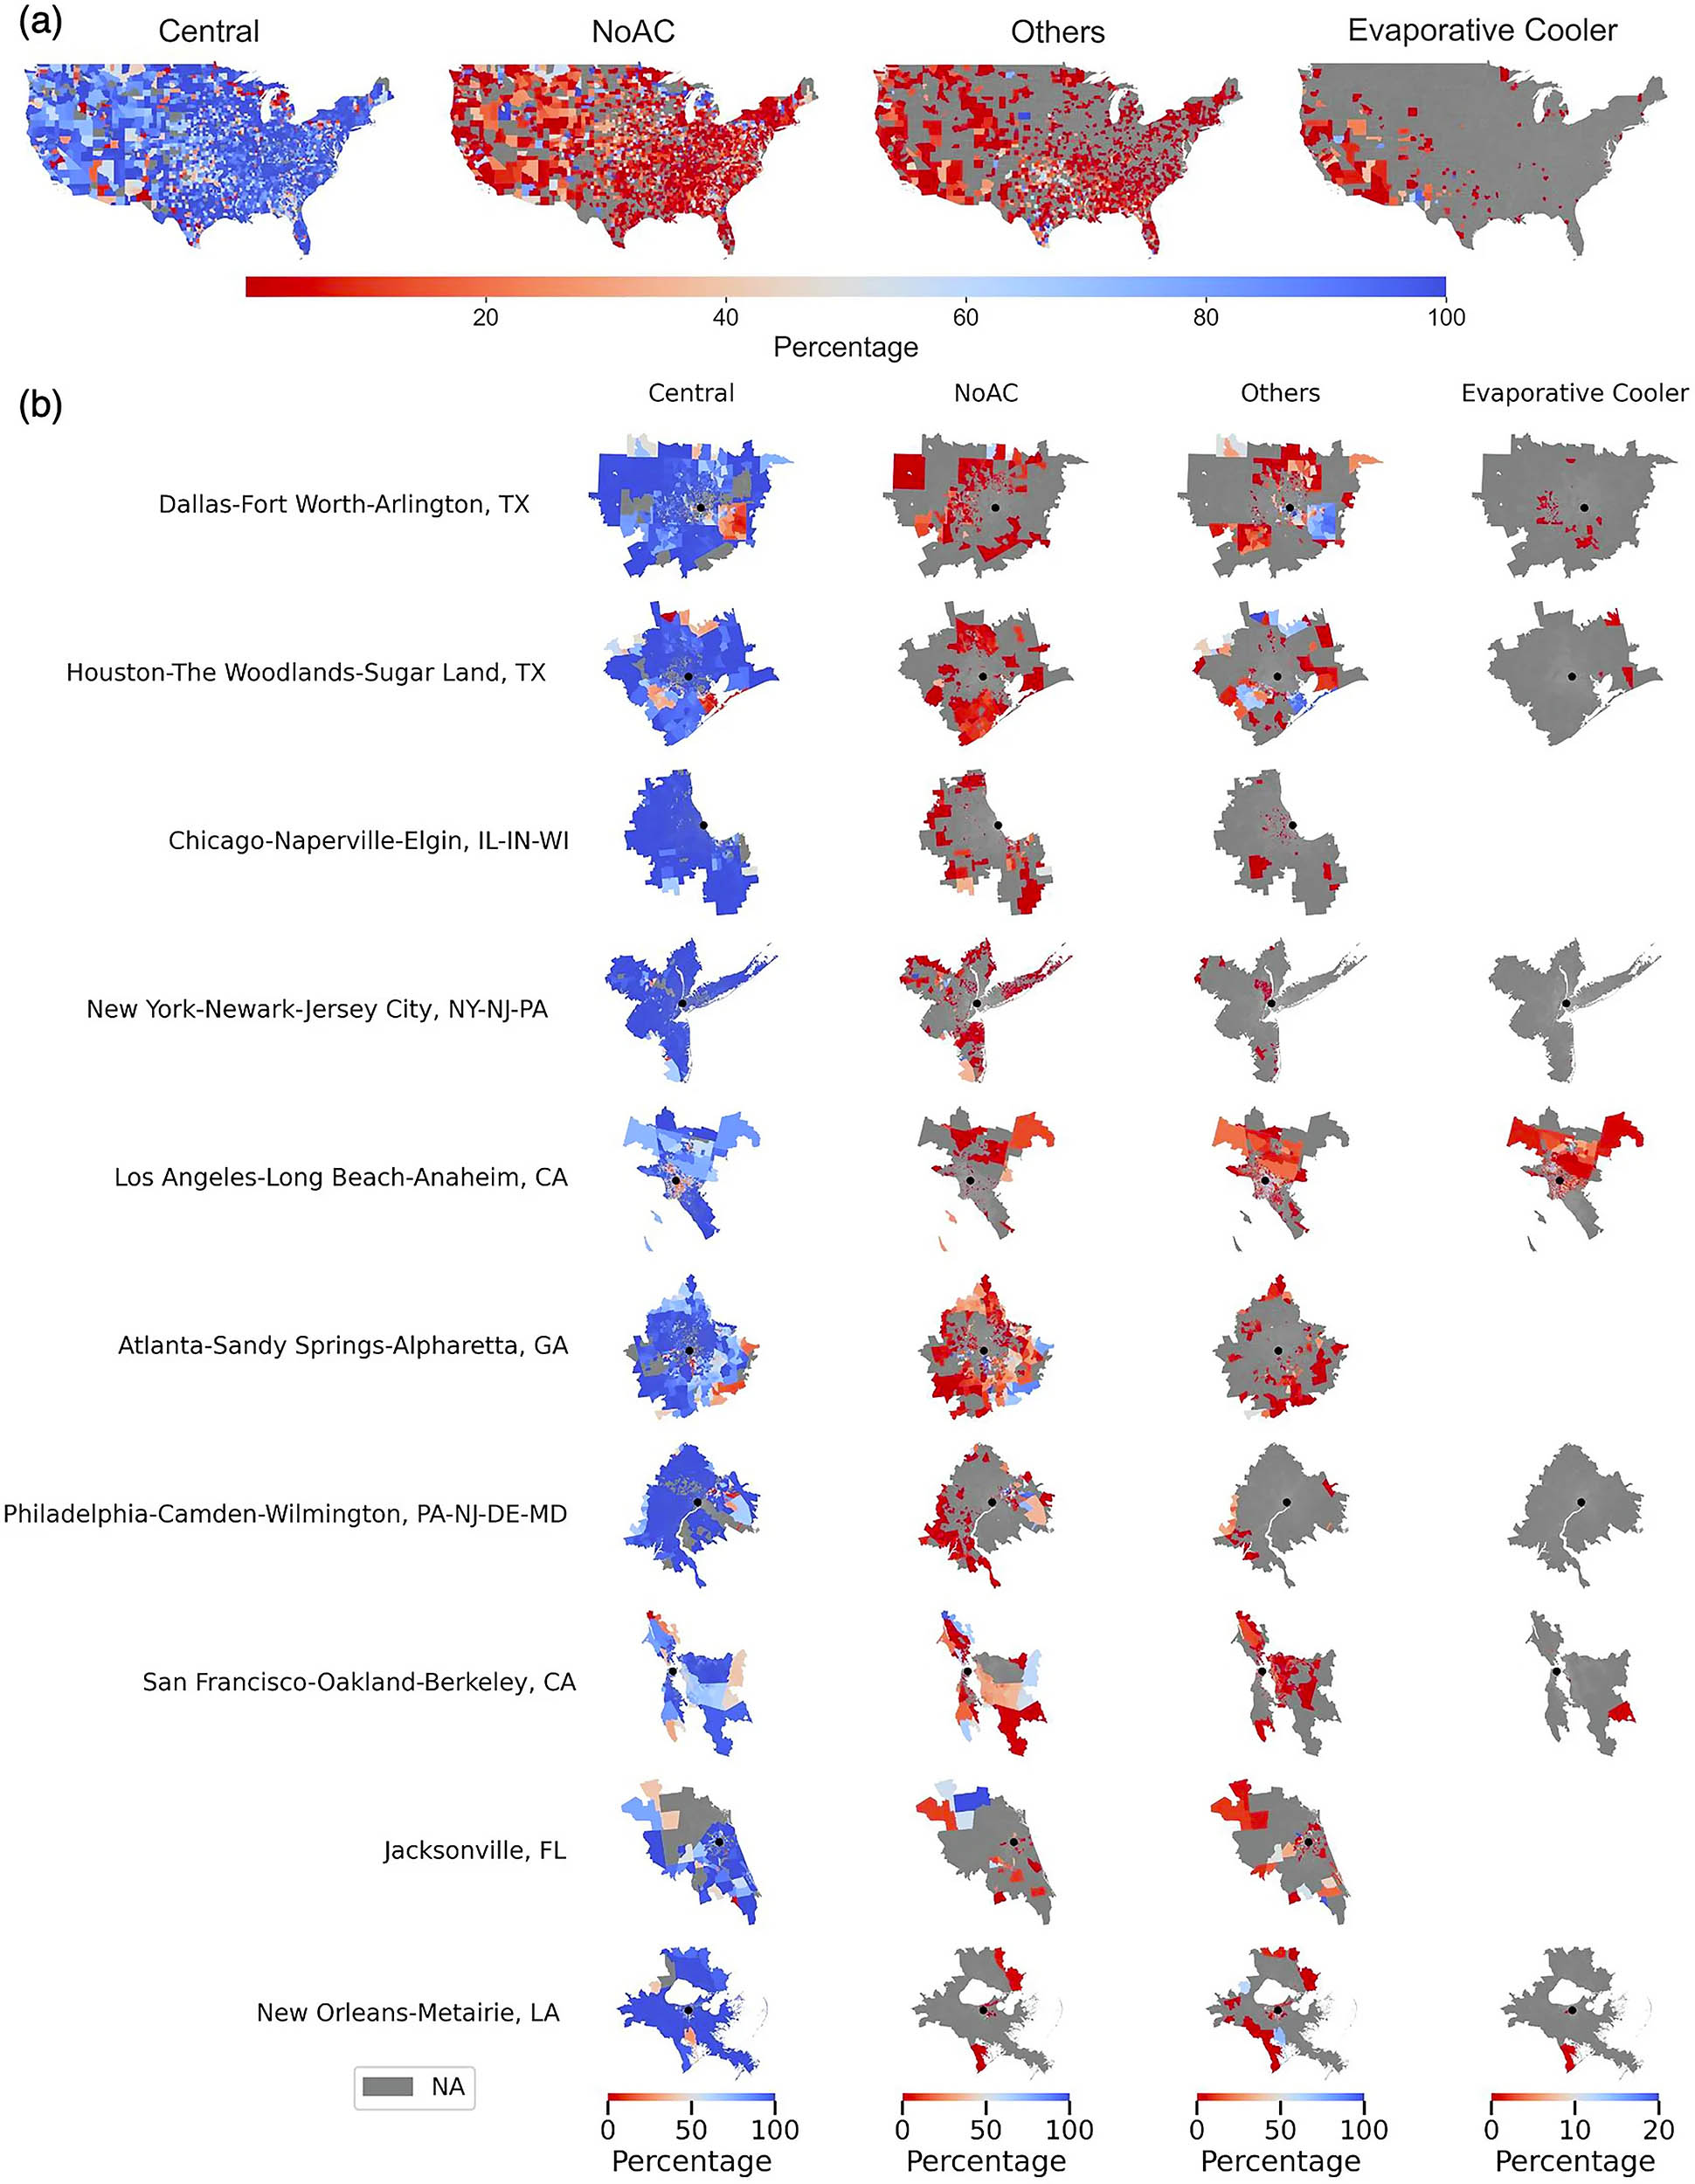
“This paper was about developing a nationwide air conditioning dataset,” Ahn said. The project mapped over 103 million U.S. homes, showing not just who owns an AC unit but what kind.
Earlier national surveys only offered broad snapshots. Ahn’s team went deeper – right down to the census tract.
They used data from Dewey’s real estate records and added information about housing type, age, renovation year, and even local climate.
“Even though 90% of Americans have some kind of AC, not all systems are equally effective,” Ahn explained. Portable or evaporative coolers often fail in humid conditions, leaving some households in unsafe heat.
Modeling cooling access
The dataset combined property and climate details with demographic and economic data. Using machine learning, Ahn and co-author Christopher Uejio filled in gaps and classified each home into one of four categories: central, other, evaporative, or none.
“Because the Dewey data had missing information that wasn’t random, I used a random forest algorithm to impute missing values,” Ahn said. “Then I used another machine learning model, XGBoost, to classify homes into four AC types.”
These models achieved up to 99% accuracy overall. The approach worked especially well for central AC, the most common system nationwide. Results revealed, though, that cooling habits depend on where people live – and who they are.
Unequal air conditioning
The results showed a clear pattern: geography drives cooling options. Hotter southern states rely heavily on central air, while arid western areas often use evaporative coolers. But the gaps grow wider when income, race, and housing history come into play.
Neighborhoods with lower income or higher Black and Hispanic populations often showed fewer or less effective systems.
“Climate and heating type were the strongest predictors overall, but the proportion of Hispanic residents was an important variable for some AC types,” Ahn said.
Historical housing policies also left their mark. Communities once redlined decades ago still report lower access to reliable cooling, showing how climate risk often follows old social boundaries.
Cities and countryside
Urban and rural homes tell different stories. “Previous studies only focused on metropolitan areas, but my dataset allowed me to compare rural and urban regions,” Ahn said.
Central air dominated in cities, but many rural areas still depend on window or evaporative units. In places like rural Oregon, central and evaporative systems were more common, while city neighborhoods saw more mixed results.
The findings also highlight lifestyle differences. City residents might cool off in public places like libraries or pools.
Rural workers, often outdoors, return to hotter indoor spaces with fewer cooling options. This contrast reveals not only energy inequality but also growing vulnerability as heat waves intensify.
Patterns behind the data
Ahn’s analysis revealed that building age and renovation history strongly predict whether a home has central AC. Newly built or upgraded houses are more likely to include efficient systems.
Older homes, often clustered in the Northeast, show inconsistent cooling patterns. Her model also linked AC presence with income and education – wealthier, better-educated neighborhoods generally have more advanced systems.
In New York City, however, the results broke pattern. “The housing stock there is older, and incomes are high, but AC types vary in ways the model couldn’t fully capture,” Ahn said.
That anomaly shows how dense, aging urban housing resists simple categorization and why one-size-fits-all climate solutions rarely work.
Data gaps and future work
The dataset covers more than 70% of U.S. homes but still faces missing data. Ahn pointed out that regions like Louisiana and North Dakota lacked reliable local records.
“Some regions have higher missing data rates, which adds uncertainty,” she said. Another challenge is time. “My dataset represents current conditions, not historical trends. I hope to develop a historical dataset from 1980 onward.”
Her next goal is to map how cooling access has changed over decades, capturing shifts driven by technology, income, and climate. That timeline could help researchers understand where adaptation succeeded and where it stalled.
Why air conditioning matters
This isn’t just about comfort – it’s about survival. The dataset gives planners, health agencies, and policymakers the tools to locate vulnerable communities before the next heat wave hits.
“It could also inform energy efficiency decisions, helping people choose the most appropriate cooling systems for their climate without unnecessary cost,” Ahn said.
The study’s accuracy, national scope, and social insights make it more than a map – it’s a warning system. As extreme heat grows deadlier, Ahn’s work shows exactly where America must cool down first.
The study is published in the journal Scientific Data.
—–
Like what you read? Subscribe to our newsletter for engaging articles, exclusive content, and the latest updates.
Check us out on EarthSnap, a free app brought to you by Eric Ralls and Earth.com.
—–


